Mathematical Model of a Lead-Acid Battery
Aim: To run a MATLAB script for the mathematical model of lead acid battery.
Introduction:
The lead–acid battery was invented in 1859 by French physicist Gaston Plante and is the earliest type of rechargable battery. Despite having a very low energy-to-weight ratio and a low energy-to-volume ratio, its ability to supply high surge currents means that the cells have a relatively large pwer-to-weight ratio. These features, along with their low cost, make them attractive for use in motor vehicles to provide the high current required by starter motors.
As they are inexpensive compared to newer technologies, lead–acid batteries are widely used even when surge current is not important and other designs could provide higher energy densities. The lead acid battery is most commonly used in the power stations and substations because it has higher cell voltage and lower cost.
Negative Plate reaction:
- Pb(s) + HSO−
4(aq) → PbSO
4(s) + H+
(aq) + 2e−
The release of two conducting electrons gives the lead electrode a negative charge.
As electrons accumulate they create an electric field which attracts hydrogen ions and repels sulfate ions, leading to a double-layer near the surface. The hydrogen ions screen the charged electrode from the solution which limits further reaction unless charge is allowed to flow out of electrode.
Positive Plate reaction:
- PbO
2(s) + HSO−
4(aq) + 3H+
(aq) + 2e− → PbSO
4(s) + 2H
2O(l)
- The total reaction can be written as
- Pb(s) + PbO
2(s) + 2H
2SO
4(aq) → 2PbSO
4(s) + 2H
2O(l)
Terms Used:
DOD: A battery's depth of discharge (DoD) indicates the percentage of the battery that has been discharged relative to the overall capacity of the battery.
SOC: State of charge (SoC) is the level of charge of an electric battery relative to its capacity.
OCV: Open-circuit voltage is the difference of electrical potential between two terminals of a device when disconnected from any circuit.
Peukert's Capcity:
`C_p = I^k*T`
here C_p is Peukert's capacity in Ah
k is Peukert's constant
I is s the actual discharge current in A
T is the actual time to discharge the battery
MATLAB Code:
%MATLAB Script to run Mathematical Model of a Lead acid Battery
clear all
close all
clc

%inputs
T = (0:50:500000); %Time=10001 steps with spacing of 50sec
CR = zeros(1,length(T)); %Charge Removed
DOD = zeros(1,length(T)); %Depth of Discharge(DOD)
V = zeros(1,length(T)); %Voltage
CS = zeros(1,length(T)); %Charge Supplied
E = zeros(1,length(T)); %Operating circuit voltage
I = [10,50,100,150,200]; %current(A)
n = 1; %No. of cell
C = 50; %Capacity in Ah
k = 1.045; %Peukert's constant
dT = (T(2)- T(1))* ones(1,length(T)); %Change in time
R_int = (0.06/C)*n; %Internal resistance
E(1) = 2.15; %circuit voltage

for i=1:length(I)
    V(i)=n*(2.15-I(i)*R_int);

%Voltage eqn for OCV
for n=2:length(T)
    dT(n) = T(n)-T(1);
    %Peukert's Capacity
    Cp = (I(i)^k)*(dT(n));

    CR(n)= (CR(n-1)+(dT(n)*(I(i)^k))/3600);
    DOD(n)=(CR(n)/Cp);
    E(n)=2.15-DOD(n)*(2.15-1.75);
    V(n)=E(n)-I(i)*R_int;

    if DOD(n)>0.99
        E(n)=0;
        V(n)=0;
    end
    if DOD(n)>1
        DOD(n)=1;
    end
    if E(n)>0
        CS(n)=CS(n-1)+((I(i)*dT(n))/3600);
    else
        CS(n)= CS(n-1);
    end
end
figure(1)
hold on
plot(DOD,V)
xlabel('DOD')
ylabel('Voltage')
end
plot(DOD, E)
legend('E-OCV','V-Voltage','I=10A','I=50A','I=150A','I=200A')
grid on

figure(2)
plot(DOD,E)
hold on
plot(DOD, V)
legend('E-OCV','V-Voltage')
xlabel('DOD')
ylabel('Voltage')
grid on

figure(3)
plot(CR,E)
hold on
plot(CR, V)
legend('E-OCV','V-Voltage')
xlabel('CR')
ylabel('Voltage')
grid on

figure(4)
plot(CS,E)
hold on
plot(CS, V)
legend('E-OCV','V-Voltage')
xlabel('CS')
ylabel('Voltage')
grid on


%end
Initially the time is given as 10001 steps with time space of 50 sec. The input variables for mathematical model are CR, CS, DOD, V, E, I, C, k.
Different discharge rates are I= 10, 50, 100,150, 200A (C/5, 1C, 2C, 3C and 4C). The 'for' loop is used to calculate values of CR, CS, E, V and DOD. The value 0.045 shows the loss of capacity due to discharge in Peukert's Constant.
And the results are plotted using the plot command.
Results:
Plot for Voltage vs DoD:
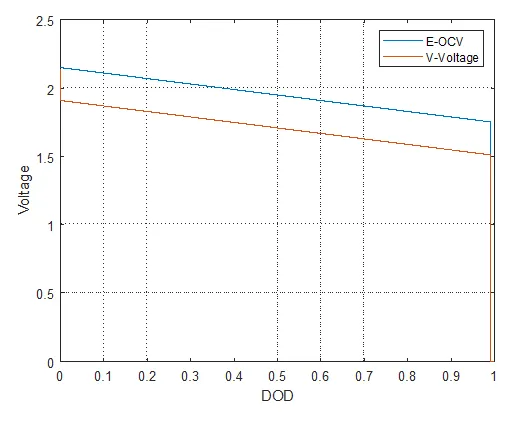
As we can see that the starting Voltage in OCV is slightly higher than the battery discharge voltage. This difference is due to the internal resistance of the battery.
Plot for DoD vs Voltage for different discharge rates of current:
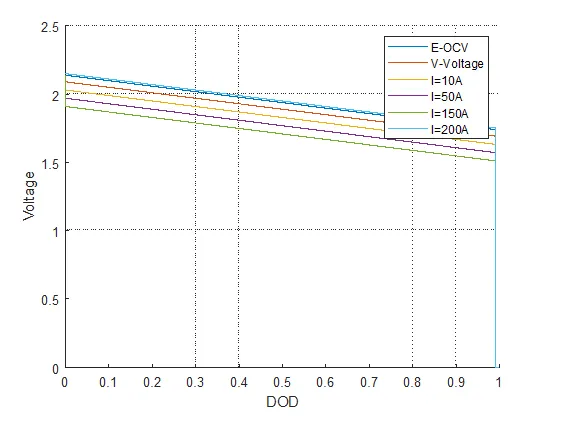
We have different discharge rates of current I = 10A, 50A, 150A,200A. As the discharge rate is increasing, the capacity of the battery is decreasing. With a higher discharge rate,we can obtain Voltages close or greater than OCV as we see in this plot.
Plot for Voltage vs Charge Removed:
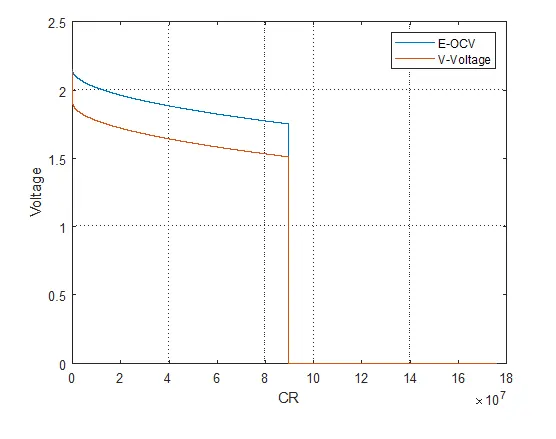
The starting Voltage in OCV is slightly higher than the battery discharge voltage due to internal resistance of the battery and the Charge Removal takes place.
Plot for Voltage vs Charge Supplied:
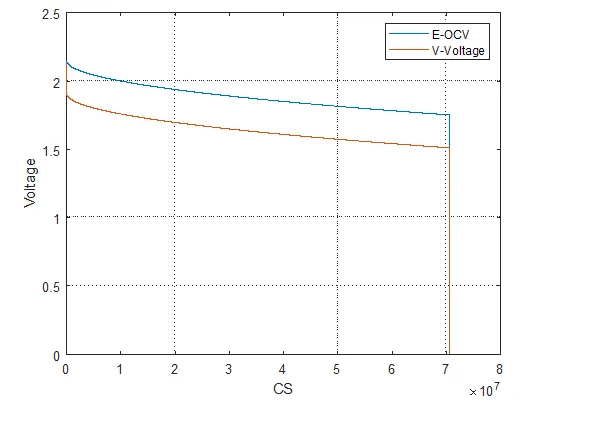
The starting Voltage in OCV is slightly higher than the battery discharge voltage due to internal resistance of the battery and the Charge Supply takes place.
Conclusion:
In all cases, we see that starting Voltage of an Open circuit is higher than the Battery discharge voltage and this may be due to Internal resistance of battery or thermal properties of electrolyte. With a higher discharge rate, we can obtain Voltages close to OCV. As the rate of discharge increases, the battery's available capacity decreases.