Structural dynamics
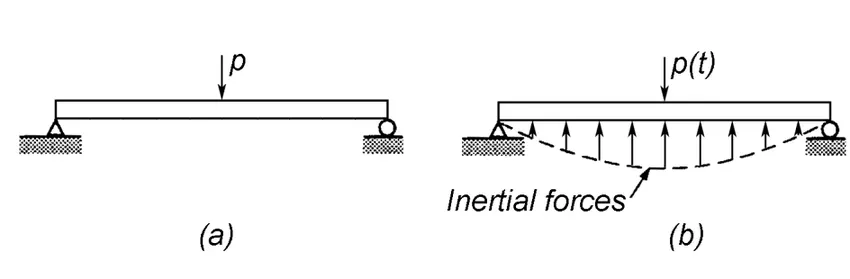
1. Differentiate Static analysis and Dynamic analysis with proper representing pictures
Ans:
- Static Analysis: Imagine a building standing still under the steady weight of its roof, floors, and furniture. That's essentially the scenario analyzed in static analysis. It deals with constant loads that don't vary with time, neglecting the effects of inertia and vibration. Think of it like taking a snapshot of the structure's internal forces and deformations at a specific moment.
-
Dynamic Analysis: Now imagine throwing a ball at the building! That's where dynamic analysis comes in. It focuses on how structures respond to time-varying loads and the resulting dynamic effects like inertia and vibration. It's crucial for structures like bridges, wind turbines, and airplanes that experience dynamic forces like wind gusts, earthquakes, and impact loads.
| Static Analysis | Dynamic Analysis |
| Static Displacement | Displacement is function of time and Frequency |
| Zero Velocity and zero Acceleration | Velocity and acceleration developed due to variation in displacement |
| Taken less Solution Time | Damping force and inertia force due to velocity and acceleration solution time taken more |
| Output is Stress and Displacement | Output: stress, displacement, velocity and acceleration with respect to time and frequency |
2. Explain the following with relevant force-displacement graph
- Elastic behavior
- Inelastic behavior
- Plastic behavior
- Non-linear Inelastic behavior
Ans:
Elastic Behavior:
- Imagine you gently press down on a rubber band. It stretches, but as soon as you release the pressure, it snaps back to its original shape. That's elastic behavior.
- In elastic behavior, the stress and strain (deformation) are proportional and directly related. This relationship is often called Hooke's Law.
- The force-displacement graph for elastic behavior is a straight line. The slope of this line represents the Young's modulus, a measure of the material's stiffness.
2. Inelastic Behavior:
- Now, imagine pushing the rubber band a bit harder. It stretches further, but when you release the pressure, it doesn't fully recover its original shape. This is inelastic behavior.
- In inelastic behavior, the stress and strain relationship is non-linear, and some deformation is permanent.
- The force-displacement graph for inelastic behavior deviates from the straight line of elastic behavior and exhibits a non-linear curve.
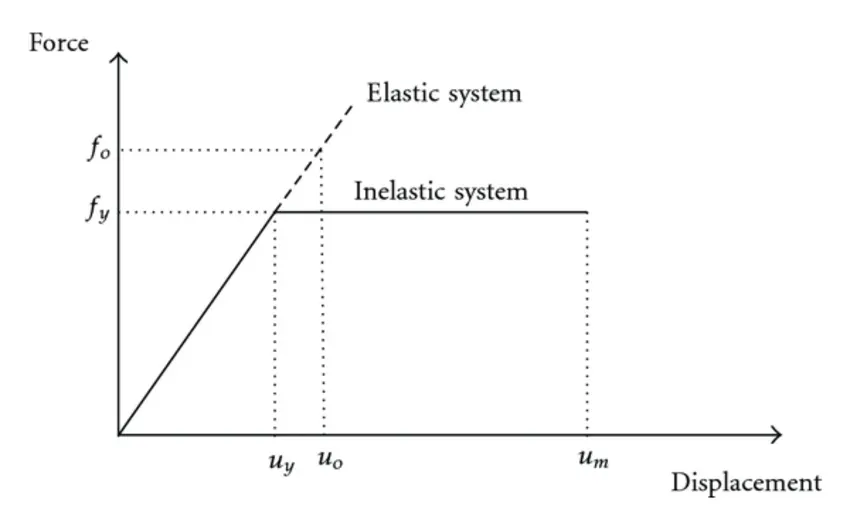
3. Plastic Behavior:
- If you keep pushing the rubber band even further, it eventually reaches a point where it permanently deforms and won't go back to its original shape, even without any force applied. This is plastic behavior.
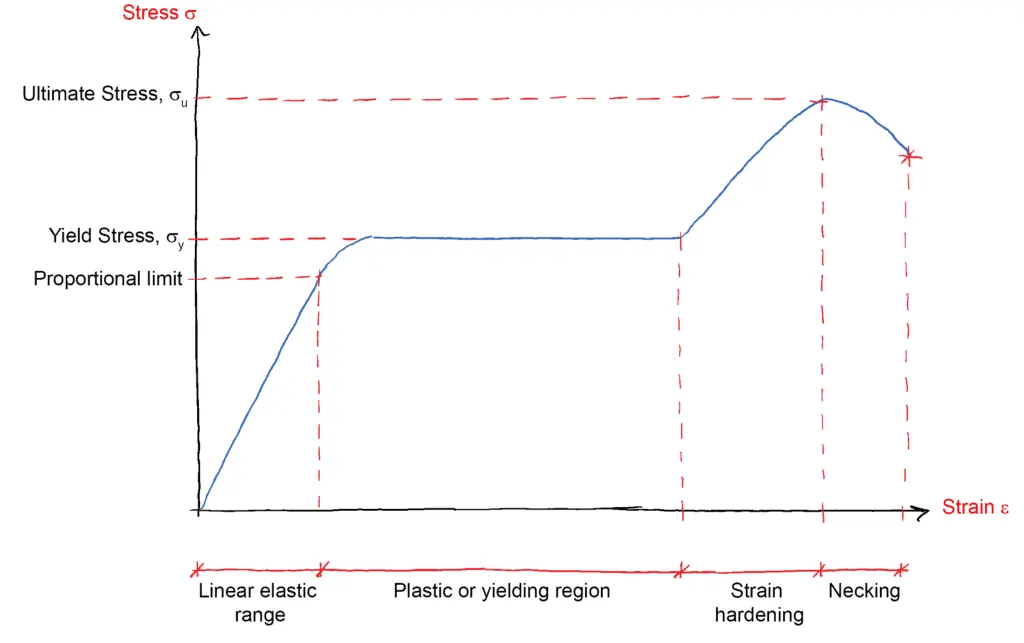
- In plastic behavior, the material undergoes significant irreversible deformation beyond a certain stress level called the yield point.
- The force-displacement graph for plastic behavior shows a distinct yield point followed by a region of plastic deformation where the stress remains constant while the strain increases.
4. Non-linear Inelastic Behavior:
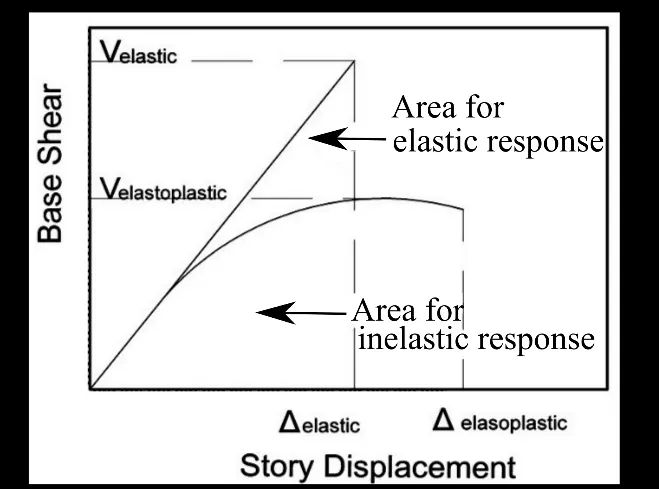
- Not all inelastic behavior is plastic. Some materials, like concrete, exhibit a non-linear relationship between stress and strain even before reaching the yield point. This is non-linear inelastic behavior.
- In non-linear inelastic behavior, the material deforms non-linearly even within the elastic range, meaning the stiffness changes as the load increases.
- The force-displacement graph for non-linear inelastic behavior is a curved line that deviates from the straight line of linear elastic behavior throughout the loading range.
3. Explain Mass, Stiffness & Damping components in the equation of motion
Ans:
In the equation of motion for a dynamic system, three fundamental components play crucial roles: mass, stiffness, and damping. Each of these elements contributes to the system's response to external forces and influences its dynamic behavior. Here's a breakdown of their individual contributions and how they're represented in the equation:
1. Mass (m):
- Imagine a ball at rest. It takes a force to set it in motion, and the greater the mass, the more force is needed to achieve a specific acceleration. Mass represents the inertia of an object, its resistance to changes in its state of motion.
- In the equation of motion, mass is often multiplied by the object's acceleration (a). This term reflects the force required to overcome the object's inertia and change its velocity.
2. Stiffness (k):
- Think of a spring. When you pull it, it resists the deformation and tries to return to its original state. This opposition to force is called stiffness. The stiffer the spring, the greater the force needed to cause the same amount of deflection.
- In the equation of motion, stiffness is typically represented by a spring constant (k) multiplied by the object's displacement (x). This term reflects the restoring force exerted by the system due to its inherent elasticity.
3. Damping (c):
- Now, imagine pushing a moving pendulum. It gradually slows down and eventually comes to rest due to frictional forces. This dissipation of energy is called damping. The higher the damping, the faster the system loses its kinetic energy and comes to equilibrium.
- In the equation of motion, damping is often represented by a damping coefficient (c) multiplied by the object's velocity (v). This term accounts for the energy lost due to friction and other dissipative mechanisms within the system.
Combined Effect in the Equation of Motion:
The equation of motion for a simple one-degree-of-freedom system typically takes the form:
mü+cu̇+ku = P(t)
Here:
- m is the mass of the object
- ü is its acceleration at time t
- c is the damping coefficient
- u̇ is its velocity at time t
- k is the spring constant
- u is its displacement from equilibrium at time t
- P(t) is the external force acting on the system at time t.
4. Provide relationship between Natural period (Tn) & Natural frequency (f) and provide their definitions
Ans:
Natural Period and Natural Frequency: A Two-Way Coin
In the fascinating world of oscillations and vibrations, two closely related yet distinct concepts reign supreme: natural period and natural frequency. Understanding their relationship and individual definitions is crucial for various fields, from physics and engineering to music and even neuroscience.
Defining the Fundamentals:
-
Natural Frequency (f): Imagine a pendulum swinging rhythmically back and forth. The number of times it completes a full cycle (swinging left and back to right) in one second is called its natural frequency, measured in Hertz (Hz). The higher the frequency, the faster the oscillation, and vice versa.
- f = 1/T
-
Natural Period (Tn): On the other hand, the natural period represents the time it takes for the pendulum to complete one full cycle, measured in seconds (s). It's essentially the inverse of the natural frequency, meaning a higher frequency translates to a shorter period, and vice versa.
- T = 2π√(k/m)
Where;
k - Stiffness, and m - Mass.
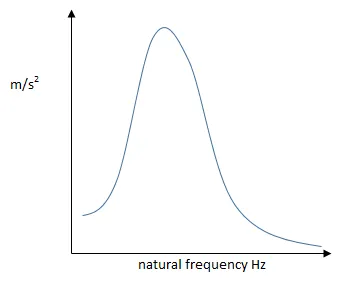
5. Explain in detail about Response spectrum & its Graph
Ans:
In the dynamic world of structural engineering, earthquakes, wind gusts, and other dynamic forces pose a constant challenge. Predicting how structures will respond to these unpredictable loads is crucial for their safety and integrity. That's where the response spectrum comes in – a powerful tool used to visualize and analyze a structure's maximum response over a range of frequencies.
What is a Response Spectrum?
Imagine a group of buildings, each with a different natural frequency, like a set of tuning forks with varying pitches. When subjected to an earthquake, each building will vibrate at its own resonant frequency, experiencing different levels of stress and deformation. The response spectrum captures this variation, summarizing the maximum response (displacement, velocity, or acceleration) of a series of single-degree-of-freedom systems (representing various natural frequencies) subjected to a specific ground motion.
Key Elements of a Response Spectrum:
- Frequency (x-axis): Represents the natural frequency of the single-degree-of-freedom systems analyzed.
- Response (y-axis): Can be peak displacement, peak velocity, or peak acceleration, depending on the chosen metric.
- Spectral Values: The points on the curve representing the maximum response for each natural frequency. These values help engineers identify critical frequencies where the structure might experience significant stress or deformation.
Interpreting the Response Spectrum Graph:
- Peak Values: Higher peaks on the curve indicate that structures with those corresponding natural frequencies are more susceptible to experiencing high stress or deformation under the specific ground motion.
- Shape of the Curve: The overall shape of the spectrum depends on the characteristics of the ground motion (e.g., near-field vs. far-field earthquake). Some shapes are more likely to excite specific frequency ranges in structures, requiring careful attention from engineers.
- Comparison with Building Properties: By comparing the spectral values with the building's natural frequency (determined through analysis), engineers can assess its vulnerability to the analyzed ground motion and identify potential weak points.
Applications of Response Spectrum:
- Seismic Design: Response spectra are a fundamental tool in earthquake-prone regions, guiding the design of buildings and infrastructure to withstand expected ground motions. By analyzing the spectral values, engineers can optimize structural elements for adequate strength and stiffness against seismic forces.
- Wind Load Analysis: Response spectra can also be used for designing structures against wind loads, particularly for tall buildings and bridges. Understanding the peak response frequencies helps engineers design for wind-induced vibrations and prevent excessive deflections or fatigue damage.
- Machine and Component Design: Beyond civil structures, response spectra can be applied in various fields like mechanical engineering to analyze the dynamic behavior of machines and components subjected to vibrations or impact loads.