Structural dynamics
1. Differentiate Static analysis and Dynamic analysis with proper representing pictures
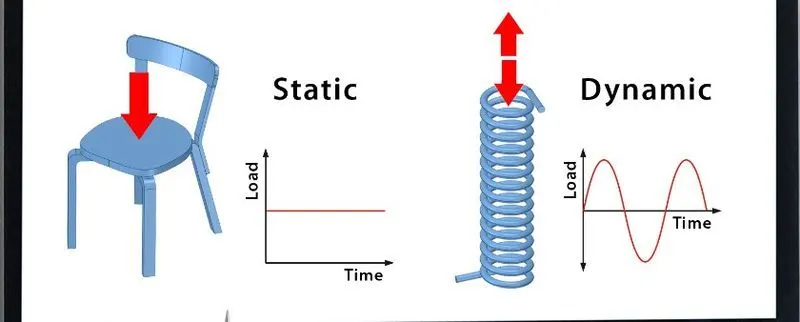
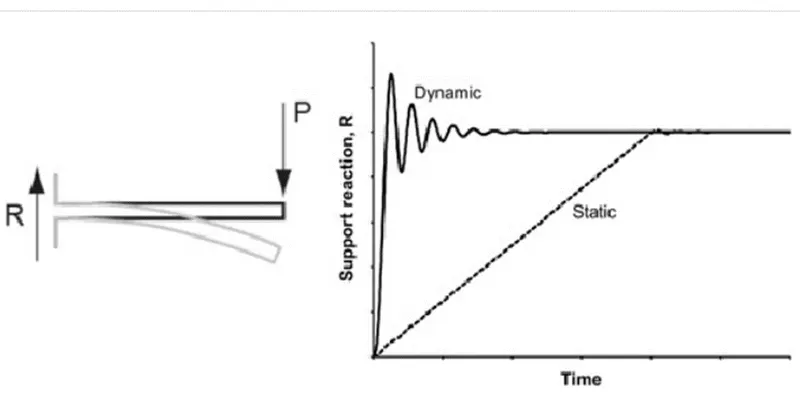
Ans: The difference between dynamic and static analysis is time. Dynamic analysis involves some load or stimulus that changes over time. Typically, these loads happen quickly. In static analysis, the loads are applied so slowly that inertia and time do not have an effect.
Static Analysis:
- Systems or bodies that are in a perfect state of equilibrium can be studied using static analysis.
- Such a component, body, or system must have zero acceleration (no motion) and no loading that changes with time.
- The simplest way to think of static analysis is a simple system where your load is applied and will never change. It is constant and therefore static.
- Static analysis of structures considers static loads acting on the structure such as dead,live load which does not vary with time and are not considered to be sudden.
- There is no necessity to count Inertia and damping forces in case of static analysis, but the elastic force should be accounted.
- There is no inertia effect on static analysis.
- In static analysis stiffness matrix alone is considered and the inertial forces are not considered
-
Here are some examples of static analysis:
- Bridge design
- Vehicle frames
- Mounting brackets
- Housing design
Dynamic Analysis:
- As the name implies, ‘dynamic’ implies that something is changing.
- With dynamic analysis, time is a factor, and loads changing with respect to time must be calculated using dynamic analysis.
- Inertial loads due to acceleration, for example, must be modelled using dynamic analysis. Alternatively, if the loads are not in the time domain, they can also be in the frequency domain for dynamic analysis.
- Inertia and damping forces should be accounted for the calculation of dynamic analysis.
- Inertia effect is considered in dynamic analysis.
- These loads are sudden and does not follow a constant pattern and vary with time.
- In dynamic analysis along with stiffness matrix, mass matrix and damping matrix is also included.
-
Here are some examples of dynamic analysis applications:
- Impact analysis
- Component drop test analysis
- Vibrational analysis
- Buckling analysis
2. Explain the following with relevant force-displacement graph (40 marks)
- Elastic behavior
- Inelastic behavior
- Plastic behavior
- Non-linear Inelastic behavior
Ans:
Elastic behavior:
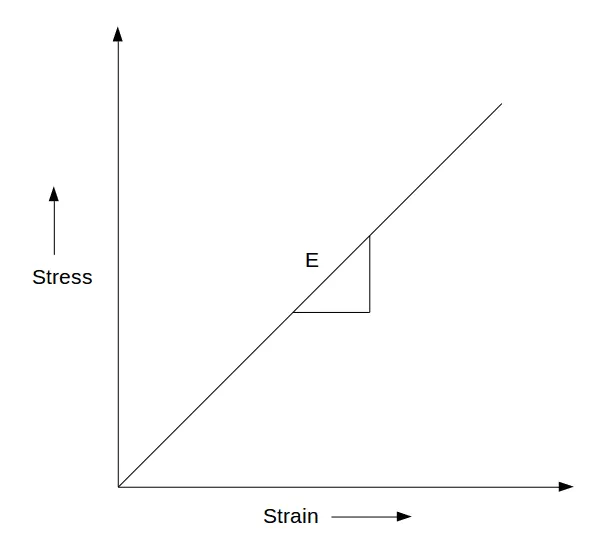
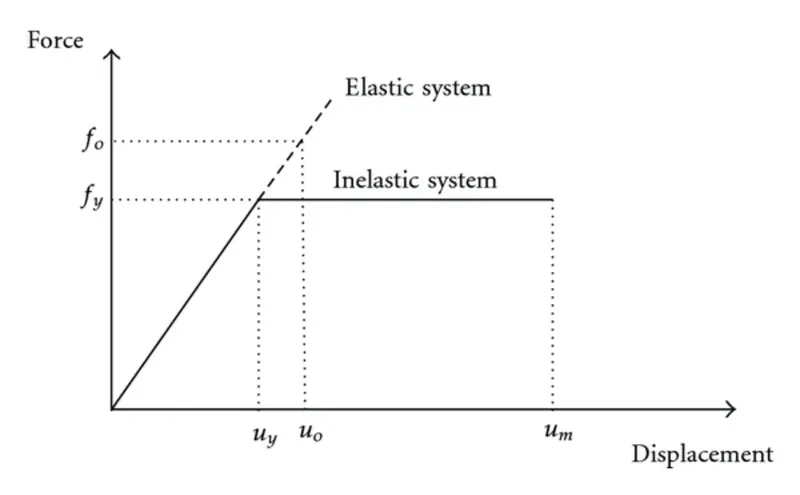
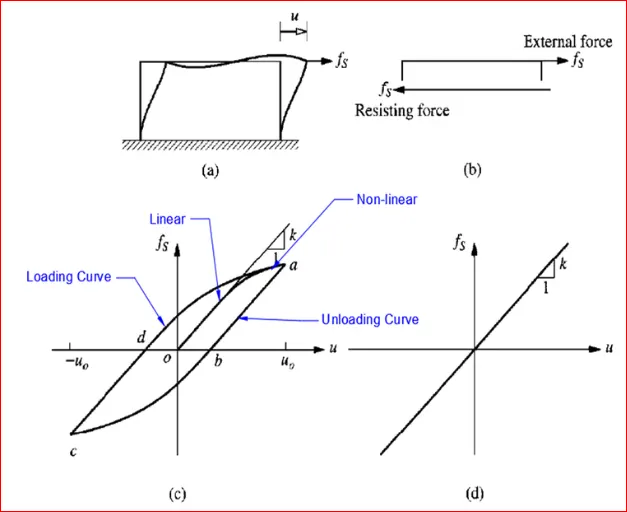
Elastic behavior is the ability of a body to resist any permanent change to it when stress is applied. That is the ability of a component to return to its original shape when an external force applied to it is removed.When stress application ceases, the body regains its original shape and size. For linear system force can be expressed as fs=ku where k is lateral stiffness constant.
Inelastic behavior:
It is the exact opposite to elastic behavior,i.e The inability of a component to return to its original shape when an external force applied to it is removed. Deformation of a material that does not disappear on removal of the force that produced it.The material undergone deformation acts opposite to elastic behaviour hence, called as inelastic behaviour.
Plastic behavior:
For stresses beyond the elastic limit, a material exhibits plastic behavior. This means the material deforms irreversibly and does not return to its original shape and size, even when the load is removed. When stress is gradually increased beyond the elastic limit, the material undergoes plastic deformation.The plastic behaviour of the structure occurs beyond the yield point of the structure and the deformation is irreversible even after the loading is being removed.
Non-linear Inelastic behavior:
Material nonlinearity is associated with the inelastic behaviour of deformation beyond the yield stress of the material since the flow stress (stress vs strain curve) in the plastic regime is essentially nonlinear. When large deformations occur at the material, the force displacement relationship of the material becomes non linear. For non linear system force can be expressed as fs=fs(u,v).
3. Explain Mass, Stiffness & Damping components in the equation of motion
Ans:
Mass component:
In equation of motion the mass components considers only the mass of the structure and stiffness and damping are being neglected. The force is related with mass component with the equation is expressed as fi=mu¨.
Stiffness component:
Here stiffness is said to be the rigidity of a material to avoid deformation and in equation of motion the force related to stiffness is considered in the structure and other forces such as mass and damping are neglected. The equation for stiffness component is given as fs=ku.
Damping component:
Damping is the inert force of the structure that helps dissipate the energy caused due to external force by vibrations over time and distances. It occurs due to the friction between structural and non stuctural elements, opening and closing of microcracks and friction at steel structures. hence the equation for stiffness component is expressed as fd=cu˙
Hence the equation of motion can be written as,
mu¨+ fd + fs = p(t) that is mu¨ + cu˙ + ku = p(t) where p(t) is the external force.
4. Provide relationship between Natural period (Tn) & Natural frequency (f) and provide their definitions
Ans:
Natural Period of vibration (Tn):-
The time required for the undamped system to complete one cycle of free vibration (unit is seconds)
It is related to the natural circular frequency of vibration, Wn, in units of radians per second.
Tn = 2π/ωn or ωn = 2π/Tn
Natural cyclic frequency (f):-
The natural frequency is defined as the number of cycles (or one complete revolution) executed by system in one second (unit is hertz). It is denoted in radians/sec.
Therefore, the relation between natural period of vibration of the system(Tn) and natural frequency(fn) is,
fn=(1/Tn)
Natural vibration properties ωn, Tn, and f depend only on the mass and stiffness of the structure.
5. Explain in detail about Response spectrum & its Graph
Ans:
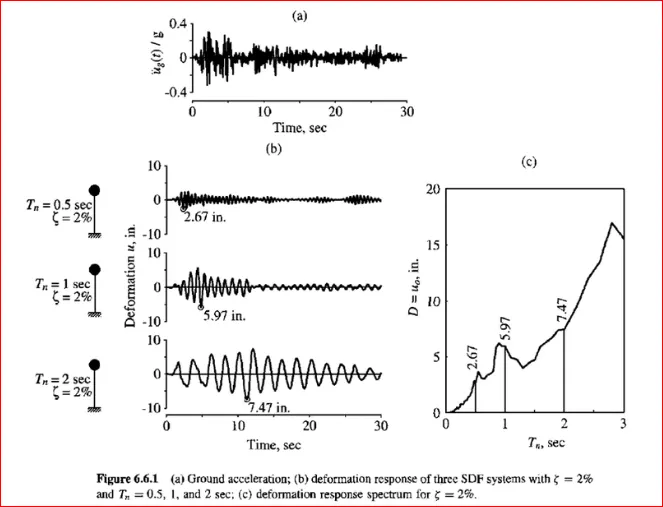
- A response spectrum is a plot of the peak or steady-state response (displacement, velocity or acceleration) of a series of oscillators of varying natural frequency, that are forced into motion by the same base vibration or shock. The resulting plot can then be used to pick off the response of any linear system, given its natural frequency of oscillation.
- A response spectrum is a function of frequency or period, showing the peak response of a simple harmonic oscillator that is subjected to a transient event. The response spectrum is a function of the natural frequency of the oscillator and of its damping.Thus, it is not a direct representation of the frequency content of the excitation (as in a Fourier transform), but rather of the effect that the signal has on a postulated system with a single degree of freedom (SDOF).
-
Response spectrum analysis is a method to estimate the structural response to short, nondeterministic, transient dynamic events. Examples of such events are earthquakes and shocks. Since the exact time history of the load is not known, it is difficult to perform a time-dependent analysis. Due to the short length of the event, it cannot be considered as an ergodic ("stationary") process, so a random response approach is not applicable either.
- The response spectrum method is based on a special type of mode superposition. The idea is to provide an input that gives a limit to how much an eigenmode having a certain natural frequency and damping can be excited by an event of this type.
- This concept helps us to summarise the peak response of all possible linear SDF system to a particular component of ground motion, conveniently and also helps us to apply this practical knowledge of structural dynamics to the design of structural and development of lateral force requirements in building codes.
- A peak value of the response spectrum can be obtained by plotting the response quantity of Displacement (u), Velocity (v) and Acceleration (a) of a response spectrum as a function of natural vibration period Tn. Each such plot is for the SDF system having fixed damping rotio and every such plot have different value of damping ratio are included to cover the range of damping values encountered in actual structures.
- This response spectrum can be of 3 type they are:
- The deformation response spectrum- It is a plot of peak displacement (u) against natural period of time (Tn) with fixed dampness.
- Relative velocity response spectrum- It is a plot of peak relative displacement.
- Acceleration response spectrum- It is a plot of peak total displacement.
Pseudo acceleration response spectrum:
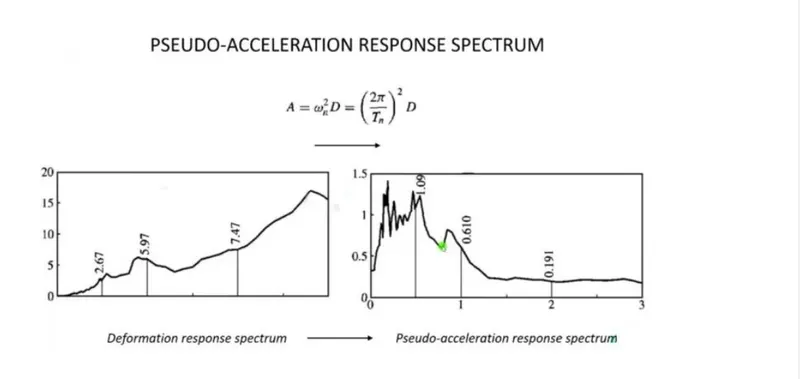
- Pseudo acceleration for a single degree of freedom system with natural frequency ωn is related to its peak deformation D = uo, due to earthquake ground motion and it's equation is expressed as
A = (ωn^2) * D = ((2π/Tn)^2) * D.
- Since the D here represents the relative displacement and not the total displace, hence it is called Pseudo acceleration response spectrum, so to avoid confusion with acceleration response spectrum.
- The quantity A has units of acceleration and it is related with base shear Vbo. The equation is expressed as
Vbo = fso = mA (or) Vbo = (A/g)*ω.
- In this formula A/g is base shear coefficient where A is acceleration and g is gravitational force.