Structural dynamics
1) Differentiate Static analysis and Dynamic analysis with proper representing pictures
(Answer):
AIM:- To Differentiate Between Static analysis and Dynamic analysis
Static Analysis:-
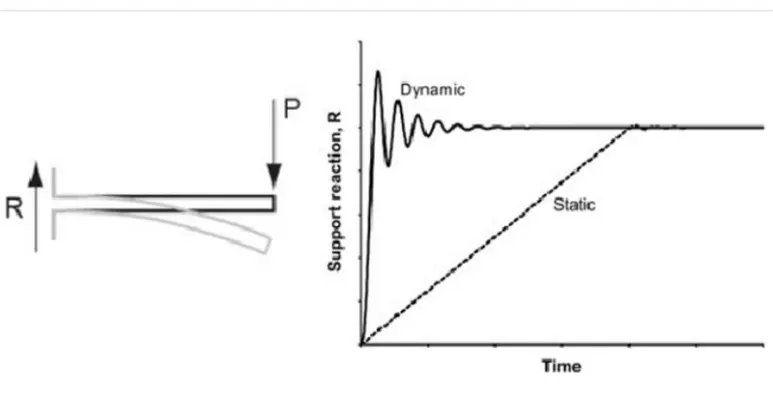
- In Static analysis we analysis static load means “a force that has constant size, position and direction on or within a structure
- Study of static load help determine the maximum allowable load to be applied to the structure
- In static analysis we use equation of equilibrium for a structure under static loading is:f=ku, where u is the displacement.
- Load is not variable with time and neglected due to slow applying of load.
- Motion of the structure can be disregarded.
- Static analysis doesn't considered inertia force along with static force.
- The displacement obtained by static analysis is more.
- Static forces does not change in size, position or in direction
Dynamic Analysis:-
- In Dynamic analysis we analysis dynamic load means” a force on a structure that change size, position or direction.
- Study of dynamic load help determine the stresses at the different points of the structure due to changing conditions over time.
- In dynamic analysis two additional force must be accounted
- Inertial Force - F= m*a( where “m” is mass, “a” is acceleration)
- Damping Force- F= c*V ( where “c” is Damping force coefficient, “V” is velocity)
- Unlike static loading's which remain constant or act in such a manner so that there is no substantial variation in structural response with time, dynamic loading's vary substantially with time, thus the structural response needs to be calculated at every time instant.
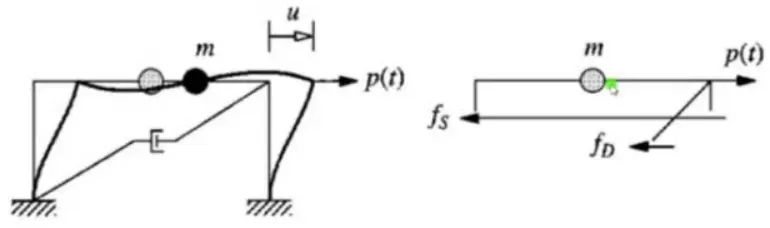
- The equation of equilibrium for a structure under dynamic loadingis:mu¨(t)+cu˙(t)+ku(t)=p(t). where, u¨ is the acceleration (the double derivative of the displacement) and u˙ is the velocity(the single derivative of the displacement).
- Load is variable with time due to fast applying of load and vibrations.
- Motion cannot be disregarded.
- Dynamic analysis considered inertia force along with dynamic force
- The displacement obtained by dynamic analysis are less.
- Whereas in dynamic forces changes in either size, position or in direction.
Example:
Structural analysis deals with the change in behaviour of a physical member under the applied loads. The nature of response of the system is completely dependent on the way the load is applied to the component. If the load applied slowly, the inertial effect defined on the basis of Newton’s first law of motion will be neglected and this is called as a static analysis. In static analysis, a single output value of solution is obtained for the system in the form of displacement, reaction forces etc. In a broader sense, static forces are considered as constant loads acting on the structure. A simple example of static load is a block of iron laying on a surface, a stationary truck etc.
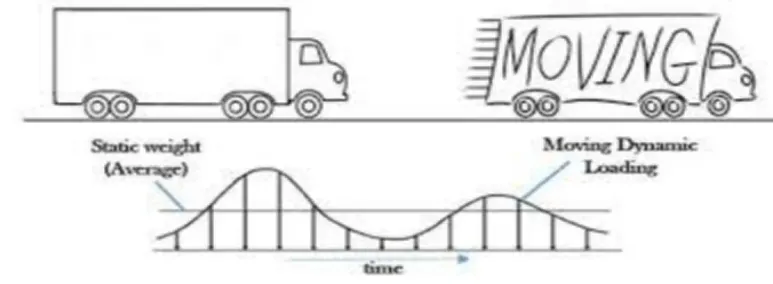
Representation of static and dynamic loads
Dynamic means time varying, and as the name suggests, the applied loads vary with time and thus induce time varying responses (displacements, velocities, accelerations, reaction forces, stresses etc). One of the most notable difference in dynamic analysis is the explicit consideration of inertial forces developed in the structure when it is excited by the time varying loads. Due to its time-varying characteristics, dynamic analysis is more realistic in nature to the actual occurring event but it also makes the modelling more computationally demanding. Some of the examples of dynamic loads are hammer striking an iron block , a moving truck on a bridge etc.

2)Explain the following with relevant force-displacement graph ?
- Elastic behavior
- Inelastic behavior
- Plastic behavior
- Non-linear Inelastic behavior
(Answer):
AIM:- To determine Forece-displacement graph for different- different behaviors.
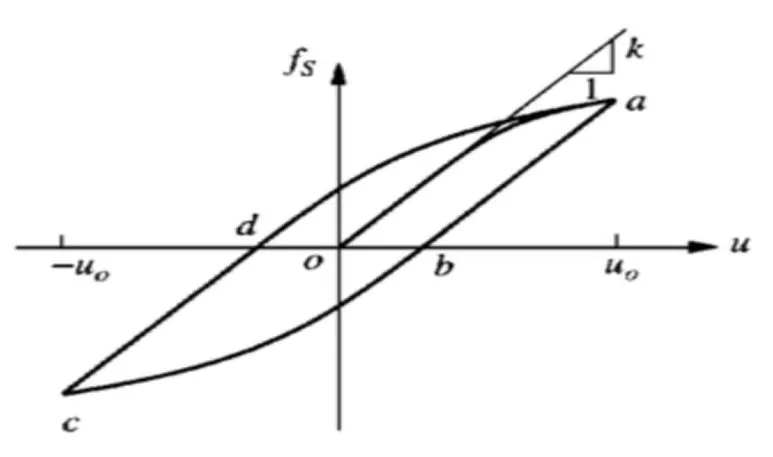
Figure:2.1
Force-Displacement graph for Elastic behavior.
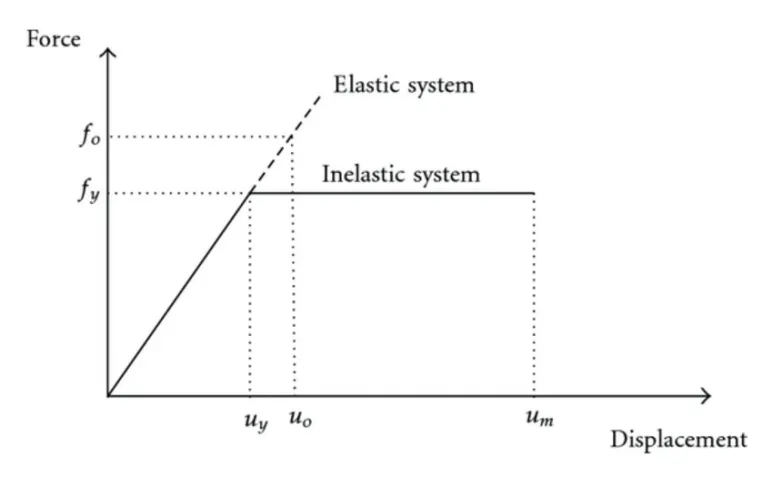
Figure:2.2
- Elasticity, ability of a deformed material body to return to its original shape and size when the forces causing the deformation are removed.
- For a linear elastic system the relationship between the lateral force fs and resulting deformation u is linear that is, fs=ku; where k is the lateral stiffness of the system; its unit are force/length.
- In linear deformation k is constant
- This deformation would be linear at smaller displacement. But would become non linear at larger deformations.
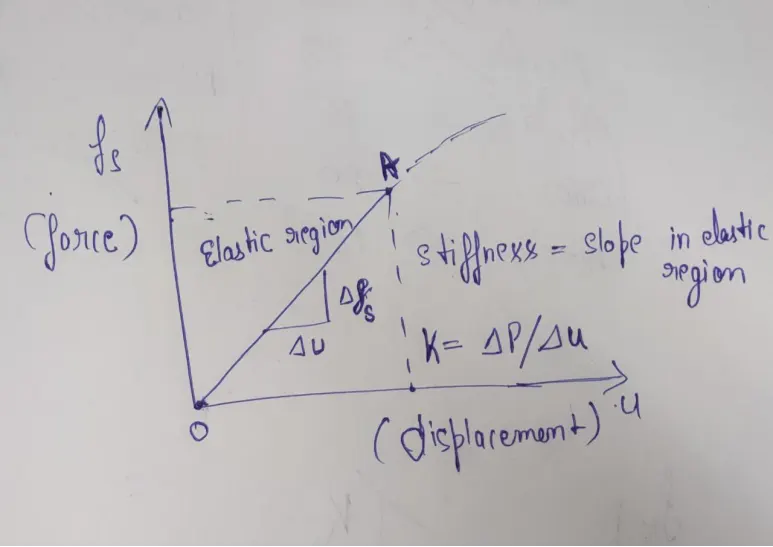
Figure:2.3
Force-Displacement Graph for Inelastic behavior.
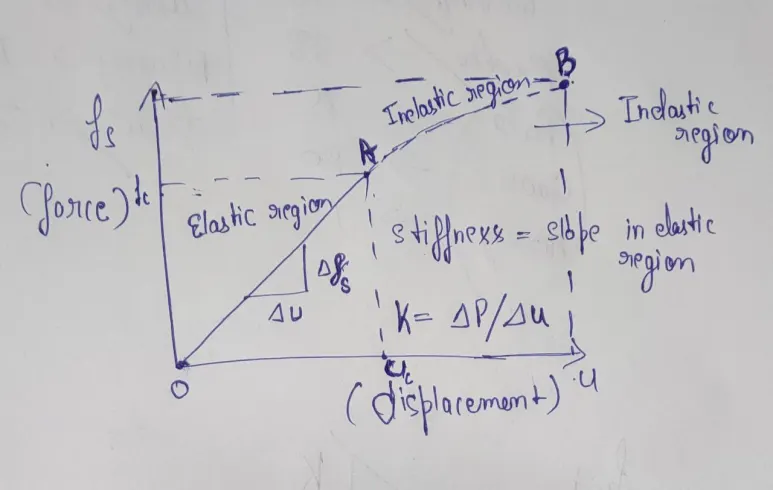
Figure:2.4
- In region AB is inelastic region in that region we apply the load to the Substance will deform permanently “ it will not regain it’s original shape”
- Inelastic behavior is the property of the material when the material can't retain it's previous shape after a certain deformation. In the aforementioned graph inelastic behavior has been shown in the upper shape of the curve upto point "a".Figure 2.1
The normalized yield strength fy* of an inelastic system is defined as follows:
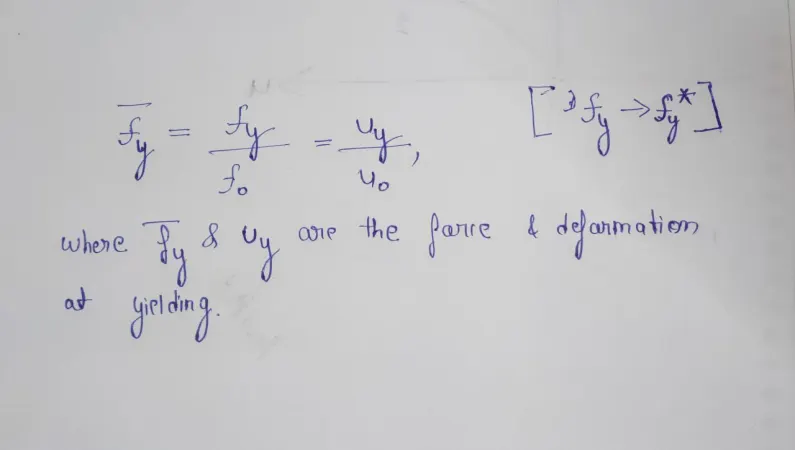
Figure:2.5
If the normalized yield strength of a system is less than unity, the system will yield and deform into the inelastic range e.g., fy0.5 implies that the yield strength of the system is one half of the minimum strength required for the system to remain elastic during the ground Motion.
Force-Displacement Graph for Plastic Behavior:
- Plastic Deformation: The material does not return to its original shape when the force is removed.
- For stresses beyond the elastic limit, a material exhibits plastic behavior.
- This means the material deforms irreversibly and does not return to its original shape and size, even when the load is removed.
- When stress is gradually increased beyond the elastic limit, the material undergoes plastic deformation.
- Plastic behavior occurs when the material completely lost it's ductility. In the above mentioned graph plastic behavior occurs during unloading after point "a".Figure:2.1
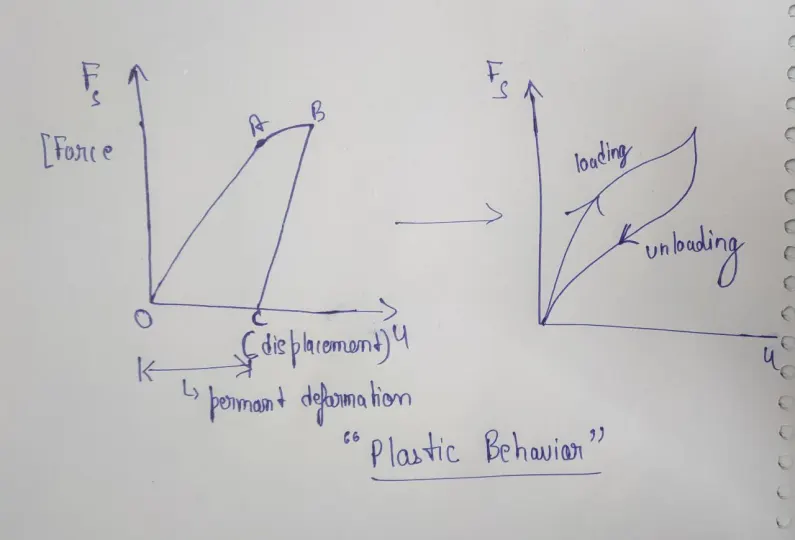
Figure:2.6
Force-Displacement Graph for Non-Linera Inelastic behavior:
- Force displacement relationship becomes non-linear and inelastic at large deformations
- Force fs corresponding to deformation is not single valued and depends on history of deformations and whether deformations is increasing or decreasing. Thus the resisting force can be expressed as: fs=fs(u,v).
3) Explain Mass, Stiffness & Damping components in the equation of motion ?
(Answer):
AIM:- To explain the Mass, Stiffness and Damping components in the equation of motion.
The single degree of freedom system can be viewed as a combination of 3 pure independent system
- The stiffness component
- The damping component
- The mass component
The stiffness component:-
- The term stiffness is used in earthquake engineering to designate how well a building will endure large lateral displacements imposed by ground shaking.
- Stiffness is a measure of how much force is required to displace a building by a certain amount.The frame without damping or mass.
- The external force fs on the stiffness component is related to displacement u by fs=ku
- If the system is linearly elastic.
The Damping component:-
- Damping is the dissipation of vibratory energy in solid mediums and structures over time and distance.
- Similar to the absorption of sound in air, damping occurs whenever there is any type of friction that diminishes movement and disperses the energy.
- The frame with its damping property but no stiffness or mass .
- The external force on the damping component is related to velocity by fd=cv.
The mass component:-
- The vertical irregularities in structures are Stiffness irregularity, Mass irregular, Vertical geometric irregularity, Discontinuity in capacity. A. Centre of Mass.
- The centre of mass is a position defined as the average position of all the parts of the system, weighted according to their masses.
- The roof mass without the stiffness or damping of the frame.
- The external force f1 on the mass component is related to acceleration by fi=mu¨
- mu¨+ fd + fs = p(t) that is mu¨ + cu˙ + ku = p(t)
Now, the external force p(t) is appilied to the complete system. They may therefore visualized among the 3 components of the structure. That is inertial, stiffness and damping force.
4)Provide relationship between Natural period (Tn) & Natural frequency (f) and provide their definitions ?
(Answer):
AIM:- To determine the relationship between Natural period and Natrual frequency.
Natural period (Tn):-
- The natural vibration of the system (Tn) is the time required for the undamped system to complete one cycle of free vibration (unit is seconds).
- It is related to the natural circular frequency of vibration, ωn, in units of radians per second. With, Tn = 2π/ωn or ωn = 2π/Tn
Natural frequency (f):-
- The number of cycle (or one complete revolution) executed by system in one second with units in hertz. Where, fn=1/Tn
- Natural vibration properties ωn, Tn and f depends only on mass and stiffness of the structure.
- - Tn, ωn, fn (Natural vibration pproperties) depends only on two quantities that is mass and stiffness.
- - ωn = sqrt(k/m), the stiffer of single degree of freedom having the same mass will have higher natural frequency and the shorter natural period.
- - Natural frequency and Natural time period is inversely proportional to each other.
- - Similary, the heavier of 2 structures (or) one with more mass and if both structure have the same stiffness. The one with the heavier mass will have the lower frequency and lower frequency and longer natural period.
- - ωn, n is natural (indicates to emphasize the natural properties of system and when it is allowed freely without any natural excitation).
- - It is important to remember that earthquake last for few seconds. The Ground motion subsides freely vibrates the structure based on the velocity, displacement impacted to it. Because, the system is linear these vibration properties are independent of displacement and velocity.
- - These properties are related to its mass and stiffness,
- - The natural vibration properties ωn, Tn and fn depends only on the mass and stiffness of the structure. That is k=mw2.
- - The stiffer of 2 single degree of freedom system having the same mass will have the shorter natural period (less time to comlete one cycle) and higher natural frequency.
- - Similarly the heavier mass of two structures having the same stiffness will have the longer natural period and the lower natural frequency. That is ωn = sqrt(k/m).
5) Explain in detail about Response spectrum & its Graph ?
(Answer):
AIM:- To Explain the Response spectrum and its graph.
Response spectrum analysis is a method to estimate the structural response to short, nondeterministic, transient dynamic events. Examples of such events are earthquakes and shocks. Since the exact time history of the load is not known, it is difficult to perform a time-dependent analysis. Due to the short length of the event, it cannot be considered as an ergodic ("stationary") process, so a random response approach is not applicable either.
The response spectrum method is based on a special type of mode superposition. The idea is to provide an input that gives a limit to how much an eigenmode having a certain natural frequency and damping can be excited by an event of this type.
The text below is separated into three parts:
- The definition of a response spectrum
- Generation of a response spectrum from a given time history
- The use of a given response spectrum in a structural analysis
In most cases, the engineer performing a response spectrum analysis is presented with a given design response spectrum, in which case the two first parts can be considered as background material.
A response spectrum is a function of frequency or period, showing the peak response of a simple harmonic oscillator that is subjected to a transient event. The response spectrum is a function of the natural frequency of the oscillator and of its damping. Thus, it is not a direct representation of the frequency content of the excitation (as in a Fourier transform), but rather of the effect that the signal has on a postulated system with a single degree of freedom (SDOF).
Analysis of an SDOF System
Consider a mass-spring-damper system attached to a moving base. The foundation has a given movement, .
.
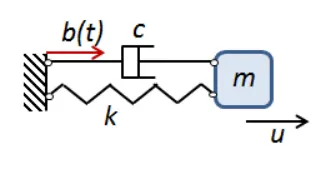
The SDOF system.
The equation of motion for the mass can, if there are no external forces, be written as

Dividing by the mass, and using customary notation,

Here, the undamped natural (angular) frequency is

and the damping ratio is

It can be seen that the support movement acts as a forcing term and that the solution depends only on the two parameters and
and  , but not on the individual values of m, c, and k.
Instead of using the absolute displacement as the degree of freedom, it is possible to choose the relative displacement between the mass and the base,  . This is actually a frame transformation where the oscillator is studied in a coordinate system attached to the base. As in any accelerating frame, there will be inertial forces. The equation of motion can be stated as
 (1)
(1)
Thus, the support acceleration appears as a gravity-like load. There are two advantages with this representation:
- The internal forces in the system — that is, elastic and damping forces — depend on relative displacements and velocities. These forces are not affected by a rigid body motion.
- Often, measured data is available in terms of an accelerogram, so that the foundation displacements are not directly available.
For given values of,, and, this equation can be solved for a sufficiently long time. The displacement, velocity, and acceleration response spectra are defined as the maximum values caused by the acceleration history .



These are all relative spectra. It is possible to do a similar definition of the absolute spectra, by instead using the absolute displacement .
Sometimes, a distinction is made between the positive and negative spectra, so that


and similarly for velocity and acceleration spectra.
The velocity and acceleration response spectra are often approximated by


Such spectra are called pseudovelocity and pseudoacceleration spectra.
For a system without damping, the pseudoacceleration spectrum based on the relative displacement is actually equal to the absolute acceleration spectrum. This can be seen from the undamped equation of motion,

Thus,

The maximum absolute value of the relative displacement must thus occur at the same time as the maximum absolute value of the absolute acceleration. The scale factor between the two is . For systems with low damping, this relation will still be approximately true. Since most mechanical systems have a low damping (often 2% to 5%), it is customary to assume that the spectra for the absolute acceleration and the pseudoacceleration are the same.
Another common way of describing the damping in this context is by the Q factor (quality factor). The relation to the damping ratio is given by

Create a Response Spectrum
- For a certain given time history, , a response spectrum is created in the following way:
- Select a frequency range for which the spectrum should be generated
- Select a frequency step that determines how many points on the response spectrum should be computed
- Select a certain damping ratio,
- For each of the selected frequencies
a. Solve Equation (1) with for a sufficiently long time
b. Keep track of the maximum value of and store it
The equation can be solved by a pure numerical time stepping, but there may be better ways of doing it. If is given as a number of points in an accelerogram, then it is natural to assume that the acceleration has a linear variation in time between those points. So, for each interval between two measurements, say from
 to
to , the equation of motion for the oscillator is

Deformation Response Spectrum:-
- Here is the paticular ground motion that is L-centro earthquake.
- The response developed for L-centro earthquake as shown.
- Now, the time variation of the deformation induced in the ground motion in 2 different single degree of freedom system is presented.
- Each single degree of freedom as its own period of vibrations that is Tn=1sec and Tn=2sec. And the damping ratio kept constant.
- Each of the single degre freedom system subjected this earthquake. That is the displacement history that we obtain.
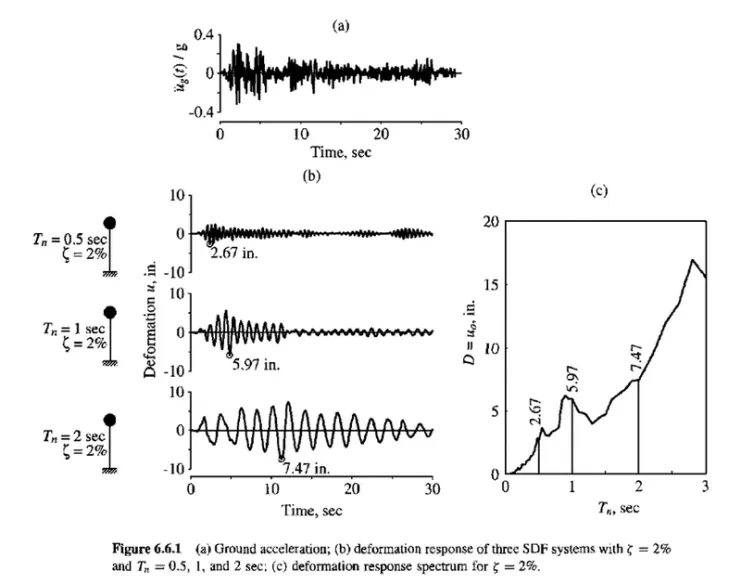
- The First Peak deformation we obtain is 2.67 inch for Tn=0.5sec and Շ = 2%
- Second Peak deformation we obtain is 5.97 inches for Tn=1sec and Շ = 2%
- The third Peak deformation we obtain is 7.47 inches for Tn=2sec and Շ = 2%
- In x-axis, it shows the natural period of vibration and y-axis peak displacement.
- Now, to determine the peak deformation value, repeat the process again and compute displacement for natural period vibration.
- For a range of single degree of freedom system with different period of vibration keep the damping ratio as constant.
- For getting the peak period of vibration that is displacement from the response spectrum curve. That deformation can be multiplied by stiffness to get equivalent static force.
- From there we can do simple structural analysis to obtain the bending moment and shear force in the structure.
Pseudo-Acceleration Response Spectrum:-
- Pseudo acceleration for an single degree od freedom system with naturak frequency ωn is related to its peak deformation D = uo, due to earthquake ground motion: A = (ωn^2) * D = ((2π/Tn)^2) * D.
- The quantity A has units of acceleration and is related to the peak value of base shear Vbo (just another name for the peak value of the equivalent static force fso): Vbo = fso = mA (or) Vbo = (A/g)*ω.
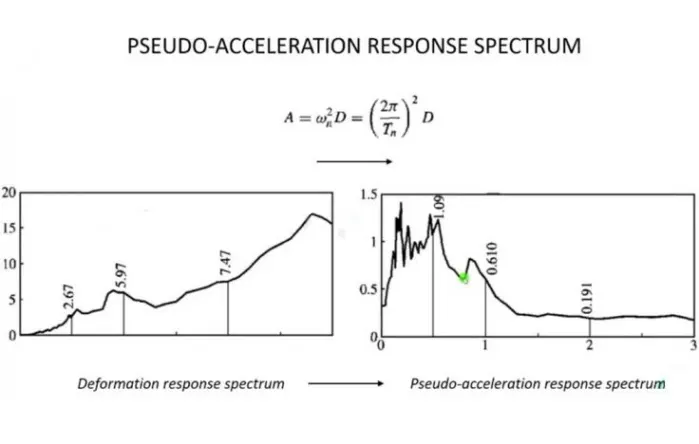
- A(t) is called pseudo acceleration and can be easily obtained by multiplying deformation at each instant of time with ωn^2 = ((2π/Tn)^2).
- Most codes worldwide are force-based values related to peak acceleration are mentioned in the code and those values can be easily multiplied by the mass of the structure to obtain the equivalent static force.
- When equivalent static force is expressed in the form of deformation.
- The stiffness of the system is to be calculated and it can be a laborious task.