Structural dynamics
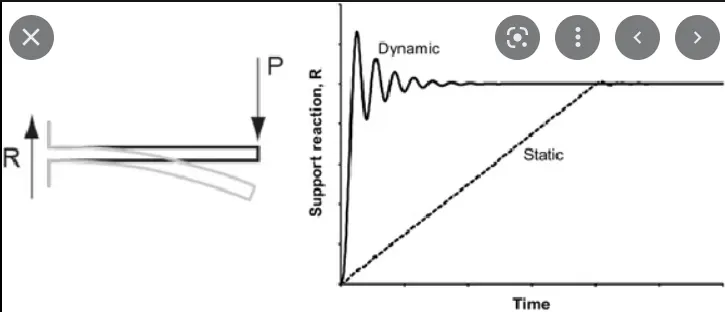
1.Differentiate Static analysis and Dynamic analysis with proper representing pictures (30 marks)
Answer:
Static analysis and dynamic analysis are two distinct approaches used in software testing and security to evaluate the quality and security of a software system.
Static analysis refers to the evaluation of software source code, binary code, or compiled code without actually executing the code. The main focus of this analysis is to find issues such as bugs, security vulnerabilities, and coding standards violations. Static analysis is often performed using tools such as code review, linting, and automated code analysis tools.
Static analysis:
Dynamic analysis, on the other hand, involves executing the code and observing its behavior in real-time. The main focus of this analysis is to find issues such as performance bottlenecks, memory leaks, and security vulnerabilities. Dynamic analysis is often performed using tools such as debuggers, profilers, and dynamic analysis tools.
Dynamic analysis:
In conclusion, both static and dynamic analysis are important techniques that should be used in conjunction to thoroughly evaluate a software system. Static analysis provides a fast and efficient way to identify issues early in the development process, while dynamic analysis provides a more complete evaluation of a system by observing its behavior in real-world scenarios.
2. Explain the following with relevant force-displacement graph (40 marks)
- Elastic behavior
- Inelastic behavior
- Plastic behavior
- Non-linear Inelastic behavior
Answer:
Elastic behavior:
Elastic behavior refers to the deformation behavior of a material in which it returns to its original shape and size after the removal of an external force. In other words, it is the property of a material to regain its original form when the stress is removed. This behavior is observed in materials like rubber and springs, which can be stretched or compressed temporarily, but return to their original form as soon as the force is removed.
The force-displacement graph for elastic behavior is linear and follows Hooke's law, which states that the force applied to an object is directly proportional to the displacement caused by that force. The slope of the graph represents the stiffness of the material. In the graph, the initial and final positions of the material are the same, and the material has no permanent deformation.
Inelastic behavior:
Inelastic behavior refers to the deformation behavior of a material in which it does not return to its original shape and size after the removal of an external force. This is because the material has undergone permanent deformation, or has reached its yield strength, which is the limit beyond which it cannot be stretched or compressed without permanent damage. Inelastic behavior is commonly observed in materials like metals and ceramics, which can deform under stress, but not recover their original form.
The force-displacement graph for inelastic behavior shows a change in slope after the yield point, indicating a change in the material's behavior. The graph is non-linear, and the material undergoes permanent deformation, which can be seen as a deviation from the original position of the material. The slope of the graph before the yield point represents the elastic behavior of the material, while the slope after the yield point represents the inelastic behavior.
Plastic behavior:
Plastic behavior refers to the deformation behavior of a material that undergoes permanent deformation and continues to deform even after the removal of the external force. This behavior is commonly observed in materials like polymers and soft metals, which can be stretched or compressed to a great extent without breaking.
The force-displacement graph for plastic behavior shows a sudden drop in the force after reaching a certain displacement, indicating that the material has undergone plastic deformation and can no longer withstand the applied force. The slope of the graph after the plastic deformation is zero, as the material can no longer carry the load, and has reached its breaking point.
Non-linear inelastic behavior:
Non-linear inelastic behavior refers to the deformation behavior of a material in which the relationship between stress and strain is not proportional. In other words, the material exhibits non-linear behavior, with changes in the rate of deformation occurring even before the material reaches its yield strength.
The force-displacement graph for non-linear inelastic behavior shows a complex relationship between stress and strain, with deviations from linear behavior at various stages of deformation. The graph is non-linear, and the slope of the graph changes at different points, indicating changes in the rate of deformation. Non-linear inelastic behavior is commonly observed in materials like soil and rock, which can exhibit non-linear behavior under extreme stress.
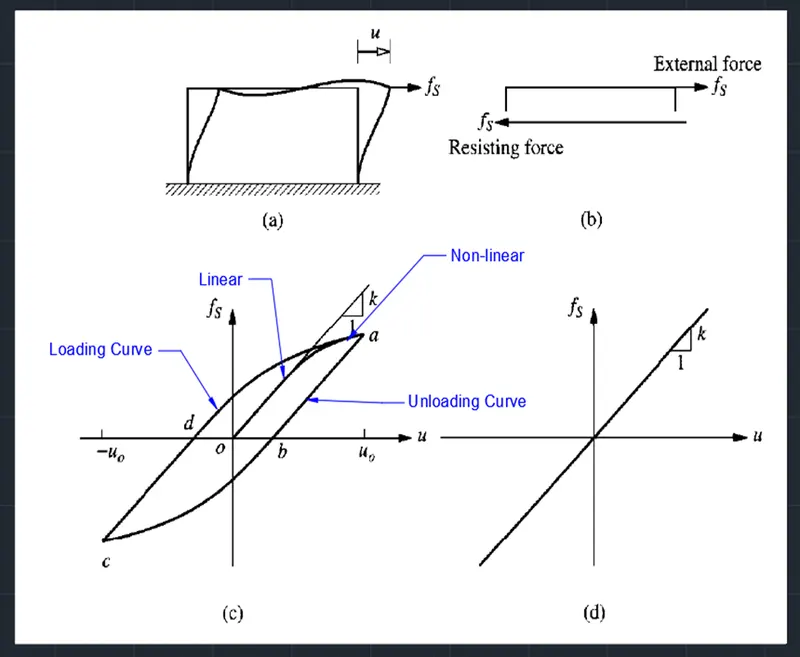
The graph represents the behavourial of the above mentioned systems and the graph obtained is based on the cyclic loading and unloading.
3. Explain Mass, Stiffness & Damping components in the equation of motion (30 marks)
Answer:
The equation of motion describes the behavior of an object in response to external forces. It is used to predict the position, velocity, and acceleration of an object as a function of time. The equation of motion is given by:
m * x''(t) + c * x'(t) + k * x(t) = F(t)
where x(t) is the displacement of the object at time t, x'(t) is the velocity, x''(t) is the acceleration, m is the mass, c is the damping coefficient, k is the stiffness, and F(t) is the external force.
Mass (m) refers to the amount of matter in an object and represents the object's resistance to changes in its velocity. The mass of an object determines its inertia, and the greater the mass, the greater the resistance to changes in velocity.
Stiffness (k) refers to the resistance of an object to deformation, and represents the material's elastic properties. The stiffness of an object determines its ability to resist deformation when subjected to an external force, and is proportional to the force required to produce a given deformation.
Damping (c) refers to the dissipation of energy in an object as a result of deformation and internal friction. The damping coefficient represents the rate at which energy is dissipated from the system and is proportional to the velocity of the object. Damping helps to reduce vibrations and prevent the over-oscillation of the system.
The coefficients m, c, and k in the equation of motion represent the dynamic behavior of the system and can be used to predict the response of the system to various loads and excitations. Understanding the mass, stiffness, and damping components is important in the design and analysis of mechanical systems, as they determine the response of the system to external forces and vibrations.
4. Provide relationship between Natural period (Tn) & Natural frequency (f) and provide their definitions (25 marks)
Answer:
The natural period (Tn) and natural frequency (f) are important parameters in the analysis of dynamic systems. They describe the inherent behavior of a system when it is subjected to an external force.
The natural period (Tn) is the time it takes for a system to complete one cycle of its natural motion, also known as the period of oscillation. It is defined as the time required for a system to complete one full cycle of its natural vibration, and is a measure of the system's response time.
The natural frequency (f) is the number of cycles completed by a system in one second, and is defined as the reciprocal of the natural period:
f = 1 / Tn
The natural frequency is a measure of the system's oscillation rate and is a measure of the system's dynamic response. It is also related to the stiffness of the system, with stiffer systems having higher natural frequencies.
The relationship between natural period and natural frequency can be described by the following equation:
f = 1 / Tn
where f is the natural frequency in Hertz (Hz), and Tn is the natural period in seconds (s).
It is important to note that the natural frequency and natural period of a system depend on the system's mass and stiffness, as well as its damping characteristics. Changes in mass, stiffness, and damping can affect the natural frequency and natural period of a system, and can be used to control and tune the dynamic response of the system.
In summary, the natural period (Tn) is a measure of the response time of a system, while the natural frequency (f) is a measure of the system's oscillation rate. The relationship between natural period and natural frequency is reciprocal,
5. Explain in detail about Response spectrum & its Graph (25 marks)
Answer:
A response spectrum is a graphical representation of the maximum response of a system to a set of harmonic excitations of various frequencies. It is used to predict the behavior of a structure when subjected to ground motion or other dynamic loads. The response spectrum provides a quick and simple method of assessing the response of a system to a wide range of excitations, making it a useful tool for seismic analysis and design.
Deformation response spectrum:
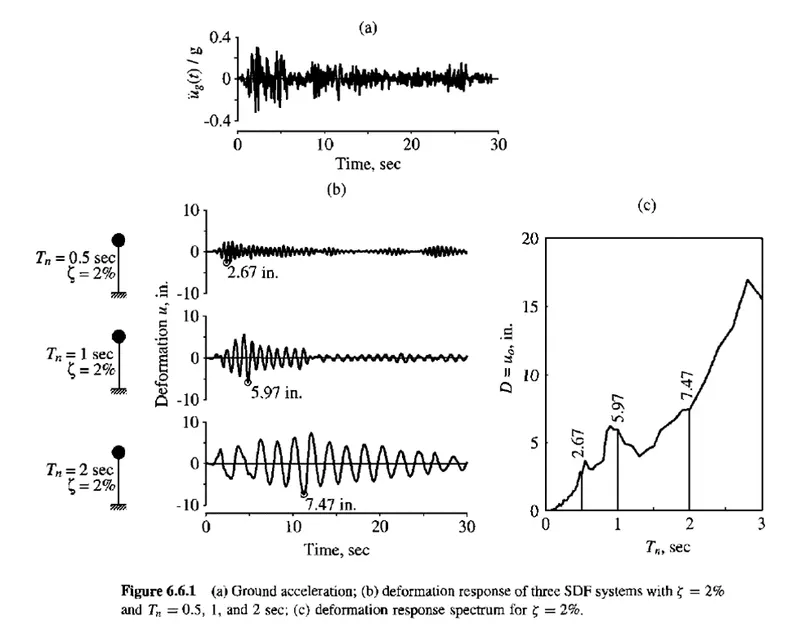
The response spectrum graph plots the maximum response of the system at each frequency of interest, rather than the detailed response at each frequency. The maximum response is determined by calculating the response of the system to a range of harmonic excitations, and selecting the maximum response at each frequency.
The excitations used in the response spectrum analysis can be either sinusoidal or broadband, and are usually selected to represent the expected loading conditions for the structure. The response of the system to each excitation is calculated using modal analysis or time-history analysis, and the maximum response is selected for each frequency. The results of the analysis are then plotted on a graph with the natural frequency of the system on the x-axis and the maximum response on the y-axis.
The response spectrum graph provides a visual representation of the dynamic behavior of a system, and allows designers to quickly assess the response of a structure to a range of excitations. The graph can also be used to compare the response of different structures to the same excitation, making it a useful tool for design and optimization.
In conclusion, the response spectrum is a graphical representation of the maximum response of a system to a range of harmonic excitations, and is used to predict the behavior of a structure when subjected to ground motion or other dynamic loads. The response spectrum provides a quick and simple method of assessing the response of a system to a wide range of excitations, making it a useful tool for seismic analysis and design.