Structural dynamics
- Differentiate Static analysis and Dynamic analysis with proper representing pictures.
Ans: The type of analysis that has to be performed is chosen by determining the nature of the loading. There are two types of loads:
Statics loads, which are the type of loads which vary with respect to time very slowly.
Dynamic loads are the type of loads that vary frequently with respect to time compared to the structure’s natural frequency.
So, the analysis which involves the static loading is static analysis and the analysis involving dynamic loading is dynamic analysis. The difference between both are as follows:
- In static analysis the load doesn’t vary or varies very slowly with time and hence is neglected, whereas, in dynamic analysis load variation is frequent compared to the natural frequency of the structure.
- In the case of static analysis motion of the structure can be disregarded, whereas, in case of dynamic analysis the structure’s motion has to be considered.
- Static analysis disregards inertia along with static force, but dynamic analysis considers both inertia and dynamic force.
- More displacement is obtained in static analysis, whereas the displacement obtained in dynamic analysis is less.
- In the case of building structures in static, the analysis is not sufficient for high ends, whereas for structures in dynamic, the analysis is sufficient for high ends.
- In static analysis inertial force and torque caused by acceleration are neglected, whereas they are considered in dynamic analysis.
Here is a pictorial representation of static and dynamic analysis:
- Explain the following with relevant force-displacement graph
- Elastic behavior
- Inelastic behavior
- Plastic behavior
- Non-linear Inelastic behavior
Ans.
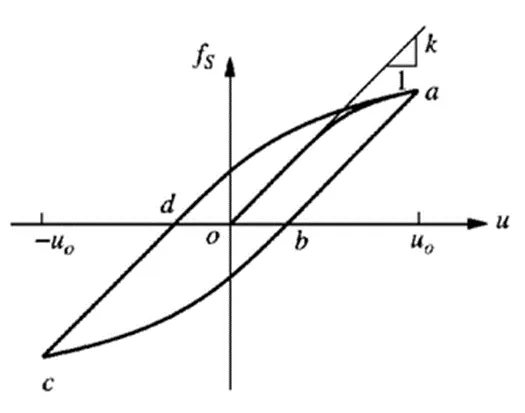
- Under cyclical deformation due to earthquakes, the initial stress curve is nonlinear and the formation amplitude increases.
- After the initial load, there is an unload and reload curve. Both are distinct from the initial load branch.
- From one point to point (a) we see that the cyclic loading becomes nonlinear.
- Then unload, then load moves in negative direction, then reload does not follow first unload path. It will go a new way.
- This means that the fs corresponding to the installation orientation (laying down) is not a single value. by deformation history
Force displacement graph of Elastic Behaviour:
- Elasticity is theability of a deformed object to return to its original shape and size once the force that caused the deformation is
- Ina linear elastic system, the relationship between the shear force fs and the resulting deformation u is That is, fs=ku; where k is the lateral stiffness of the system. Its units are force/length.
- Forlinear deformation, k is
- This deformation becomeslinear at smaller However, it becomes non-linear as the deformation increases.
- Elastic behavior is the property of a material that allows it to maintain its shape. As can be seen fromthe graph above, the graph is linear from '0' to some point, indicating its elastic properties.
Force-displacement graph of inelastic behavior:
- When subjected to extreme loads, the structure is allowed limited deformation beyond its elastic limit.
- This deformation is called "inelastic". This is because unlike elastic deformation, the structure does not return to its original position when unloaded.
- Inelastic behavior is the property of a material when it fails to retain its previous shape after a certain deformation.
- In the graph above, the inelastic behavior was shown in the form of the upper part of the curve up to point 'a'.
Force displacement graph of Plastic Behavior:
- At loads above the yield point, the material exhibits plastic behavior.
- As a result, the material deforms irreversibly and does not return to its original shape and size when the load is removed.
- As the stress gradually increases beyond the elastic limit, the material undergoes plastic deformation.
- Plastic behavior occurs when a material completely loses its ductility. In the above figure, plastic behavior occurs upon unloading after point 'a'.
Force displacement graph of Non-linear inelastic behavior:
- The force-displacement relationship becomes nonlinear and inelastic for large deformations.
- The force fs corresponding to deformation is not monovalent but depends on the deformation history and whether the deformation is increasing or decreasing.
- Therefore, drag can be expressed as: fs=fs(u,v).
- Nonlinear inelastic behavior occurs after the line from 'O' tends to bend towards point 'a'.
- Explain Mass, Stiffness & Damping components in the equation of motion
Ans:
A single degree of freedom system can be viewed as a combination of three purely independent systems.
Rigid Components
Damping Components
Mass Components
Rigid Components: Buildings withstand large lateral displacements due to ground shaking.
Stiffness is a measure of the force required to move a building a certain amount. A frame without cushions or mass.
The external force fs of the rigid component is related to the displacement u by fs=ku.
If the system is linear elastic.
Damping Components: -
* damping is the dissipation of vibrational energy in solid media and structures with time and distance.
Similar to the absorption of sound in air, some form of friction reduces motion and damping occurs whenever energy is dissipated.
A frame with damping properties, but no stiffness or mass.
The external force on the damping element is related to the velocity fd=cv.
Mass Components:
Vertical irregularities in the
structure are stiffness irregularities, mass irregularities, vertical geometric irregularities, and capacitance discontinuities. A. Center of gravity.
The centroid is defined as the average position of all parts of the system, weighted by their mass.
Roof mass without frame stiffness or damping. The external force f1 on the
mass component is related to the acceleration by fi=mu¨
mu¨+ fd + fs = p(t) i.e. mu¨ + cu˙ + ku = p(t). p(t) applies to the entire system. They can therefore be visualized under the three components of the structure.
- Provide relationship between Natural period (Tn) & Natural frequency (f) and provide their definitions
Natural Vibration (Tn):-
The natural vibration (Tn) of a system is the time (in seconds) it takes for an undamped system to complete one cycle of free vibration.
This refers to the natural circular oscillation frequency ωn in units of radians per second. Tn = 2π/ωn or ωn = 2π/Tn
Natural Frequency (f):-
The number of cycles the system performs in one second (or one complete revolution). The unit is hertz. where fn=1/Tn
The natural vibration characteristics ωn, Tn, and f depend only on the mass and stiffness of the structure.
- Tn,ωn,fn (natural vibrational properties) depend only on two quantities: mass and stiffness.
- ωn = sqrt(k/m), a stiffer single degree of freedom with the same mass has a higher natural frequency and a shorter natural period.
- Natural frequency and natural time are inversely proportional to each other.
- Similarly, if the heavier (or) more massive of the two structures, and both structures have the same stiffness. Those with more mass have lower frequencies, lower frequencies, and longer natural periods.
- ωn, n is natural (emphasizes the natural properties of the system and shows the case where it is freely allowed without natural excitations).
- It's important to remember that earthquakes last only a few seconds. Ground motion allows structures to vibrate freely based on applied velocity and displacement. Since the system is linear, these vibrational properties are independent of path and velocity.
- These properties are related to its mass and stiffness.
- The natural vibration properties ωn, Tn, and fn depend only on the mass and stiffness of the structure. This is k=mw2
- Explain in detail about Response spectrum & its Graph
A central concept in earthquake engineering, the response spectrum is a practical means of characterizing ground motions and their effects on structures with different Tns.
Peaks of all possible linear systems with a single degree of freedom Provides a convenient means of summarizing the response.Specific components of ground motion.
It also provides a practical approach to applying structural mechanics knowledge to the design of structures and the development of shear requirements in building codes. The
response spectrum represents the peak values of the response variables (u, v, and a) as a function of the period of the system's natural vibrations Tn, or related parameters such as the angular frequency ωn and the vibrational frequency fn of this set .
Each of these diagrams is for a one-degree-of-freedom system with a fixed damping ratio c, and several such values for various values of c are used to cover the range of damping values encountered in practical structures. diagrams are included.
Different response spectra can be defined depending on the displayed response size. Consider the next top answer. There are two types of
response spectra. The strain response spectrum is a plot of peaks u and Tn against constant ç. A similar plot of
peak u ˙ is the relative velocity response spectrum and peak u ¨ is the acceleration response spectrum.
Deformation Response Spectrum:-
This is a specific seismic motion that is an L-centro earthquake.
As indicated, the response evolved for L-centro earthquakes.
Here the time course of deformation induced by ground motion is shown for two different systems with one degree of freedom.
individual degrees of freedom are represented as unique oscillation periods of Tn=1 s and Tn=2 s. and the damping ratio remained constant
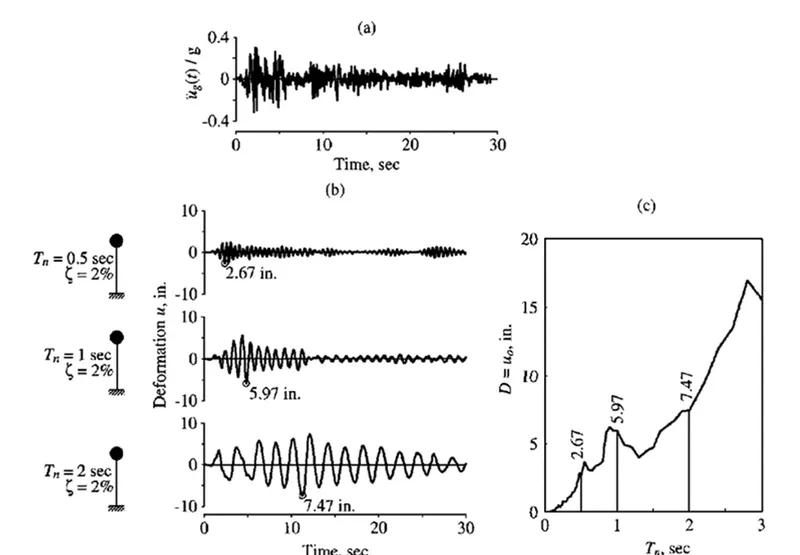
The first peak deformation is 2.67 inches for Tn = 0.5 s and Շ = 2%.
The second peak deformation is 5.97 inches for Tn = 1 sec and Շ = 2%. Tn = 2s and Շ = 2%
The x-axis is the natural period and the y-axis is the peak displacement.
Now repeat the process once more to calculate the eigenmode displacements in order to determine the peak deflection values.
Keep the damping ratio constant for many systems with one degree of freedom and different periods of oscillation. Get the peak period of the vibration, which is the offset from the
response spectrum curve. You can multiply this deflection by the stiffness to get the equivalent static force.
From there a simple structural analysis can be performed to obtain the bending moments and shear forces of the structure.
pseudo-acceleration response spectrum:-
pseudo-acceleration of a single degree of freedom system with natural frequency ωn is related to its peak deformation D = uo due to seismic motion: A = (ωn^2) * D = ( (2π/ Tn)^2) * D.
The quantity A has acceleration units and is related to the peak base thrust Vbo (another name for the peak equivalent static force fso): Vbo = fso = mA (or) Vbo = (A/g)*ω.relative
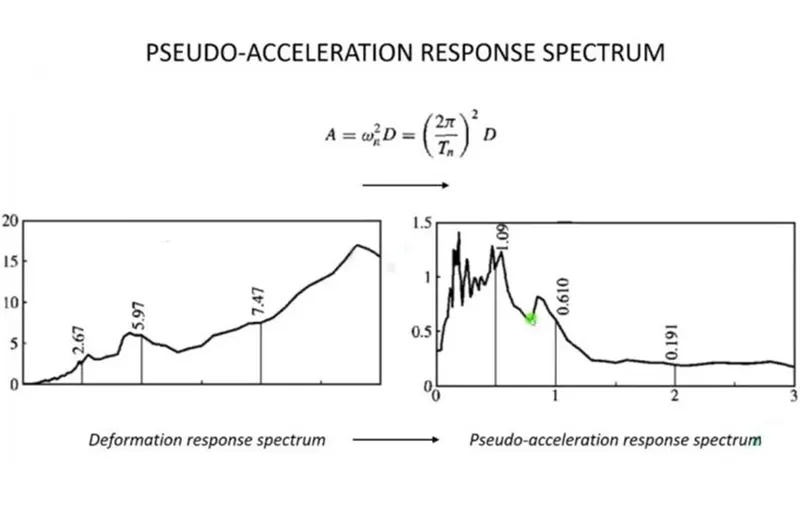
A(t) is called the pseudo-acceleration and can be easily obtained by multiplying any instantaneous deformation by ωn^2 = ((2π/Tn)^2).
Most codes around the world are force-based values for the peak acceleration given in the code, and these values can be easily multiplied by the mass of the structure to get the equivalent static force.
as an equivalent static force expressed in terms of deflection. The stiffness of the
system needs to be calculated, which can be a tedious task.