Python project for Flow over bicycle
Aim:
Write a Python program to calculate drag force against a cyclist.
Objectives:
Write a program to plot Velocity vs Drag force and write a program to plot Drag Co-efficent vs Drag force. Addition to this we might understood how the size and shape will play the vital role in calculating the drag force. Finding Drag force to improve the designing of the vehicles to perform the best speed and fuel efficiency.
Drag force:
The drag force, FD, depends on the density of the fluid, the upstream velocity, and the size, shape, and orientation of the body, among other things. One way to express this is by means of the drag equation. The drag equation is a formula used to calculate the drag force experienced by an object due to movement through a fluid.
`Fd = 1/2CdArhoV^2`
where Fd is the Drag force
Cd is the Drag co-efficient
A is the frontal area or reference area
`rho` is the dencity of the fluid (here air is the fluid)
V is the velocity
The reference area, A, is defined as the area of the orthographic projection of the object on a plane perpendicular to the direction of motion. For hollow objects, the reference area may be significantly larger than the cross-sectional area, but for non-hollow objects, it is precisely the same as a cross sectional area.
PYTHON PROGRAMS:
"""
Program to calculate the drag force
by Kistapillai
"""

import matplotlib.pyplot as plt

# Inputs

# Drag co_efficient

c_d = 1.1

# Frontal area

A = 5.5

# Density

rho = 1.225

# Bi-cycle velocity
velocities = [2,3,4,5,6,7,8,9,10,11,12,13,14,15,16,17,18,19,20,21,22,23,24,25,26]
drag_forces = []

for velocity in velocities:
	drag_forces.append((0.5*c_d*A*rho*velocity*velocity))

plt.plot(velocities,drag_forces)
plt.xlabel('Velocity')
plt.ylabel('Drag force')
plt.legend(['DRAG FORCE'])
plt.show()
"""
Program to calculate drag_co efficient
by Kistapillai
"""
import math
import matplotlib.pyplot as plt
import numpy as np
# inputs
# Drag coefficient
c_d = 1.1*np.ones(25)
# Area m^2
A = 5.5
# Density kg/m^3
rho = 1.225
# velocity
velocities = [2,3,4,5,6,7,8,9,10,11,12,13,14,15,16,17,18,19,20,21,22,23,24,25,26]
drag_forces = []
for velocity in velocities:
drag_forces.append((0.5*c_d*A*rho*velocity*velocity))
plt.plot(c_d,drag_forces)
plt.legend(['DRAG COEFFICIENT'])
plt.xlabel('Drag coeffieient')
plt.ylabel('Drag force')
plt.show()PLOTS:
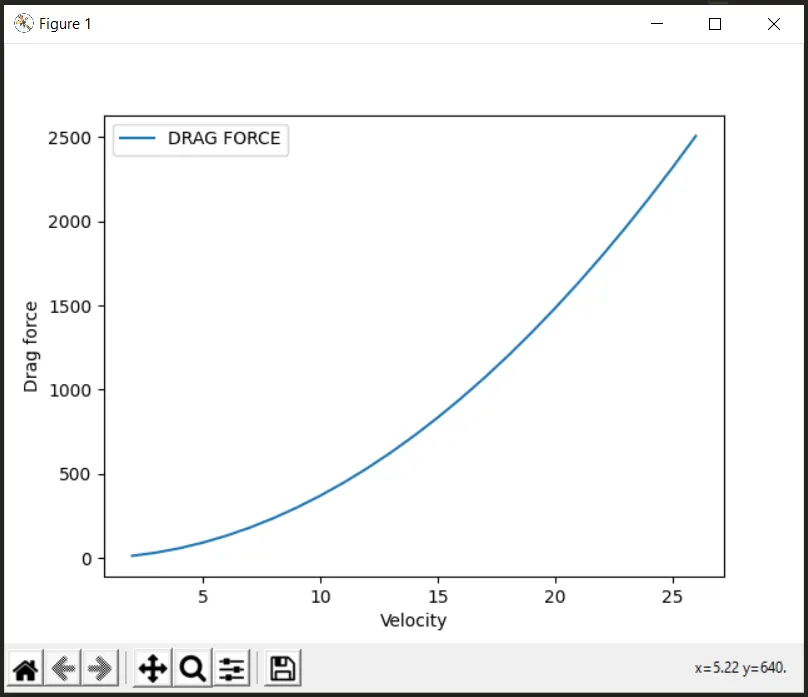
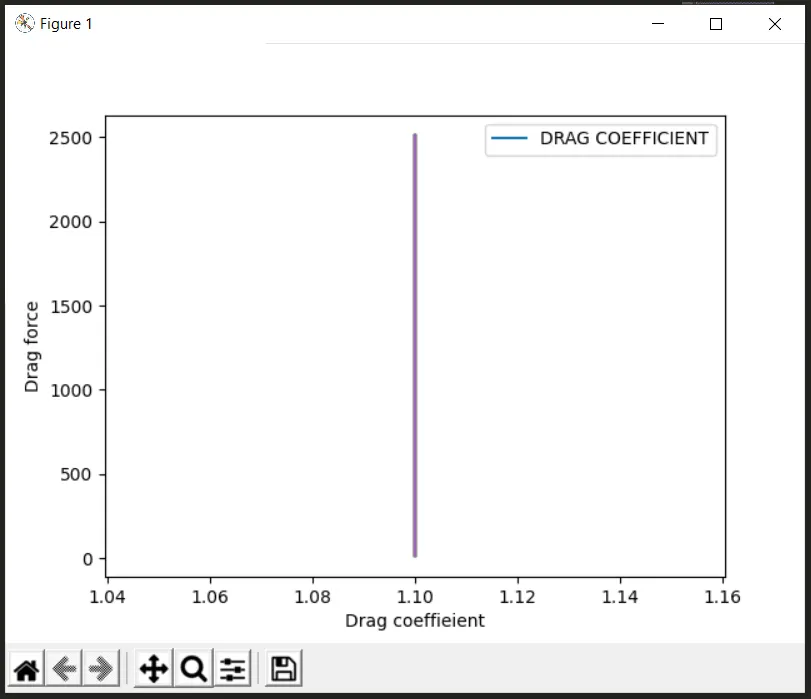
EXPLANATION OF CODES:
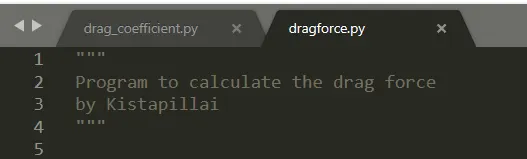
Program name and Author. In between open and close with three double open inverted commas it become as a commend.

This is one of the Python module, where it is used for: our code to plot a graph.

This module used for executing mathamatical functions.

Python NumPy is the core library for scientific computing in Python. NumPy provides a high-performance multidimensional array object and tools for working with these arrays.
ERRORS FACED:
Most of the errors due indentation error.
Python is a procedural language. The indentation error can occur when the spaces or tabs are not placed properly.
Indentation errors are rectified by read the program carefully and proper spaces placed.
RESULTS:
Thus the drag force and drag coeffiecnt are calculated with Python program, apart from that, understood the different types modules, indentation errors and so on.