PWM Controlled Fan Load using DC motor
PWM Controlled Fan load using DC Motor
AIM:-
To design a Simulink model of PWM controlled fan load using DC motor.
OBJECTIVE
- Explain each model parameters and blocks.
- To check out performance parameters; Speed, Voltage, Torque, Current and Angular displacement.
- To characterize the Speed-Torque curve.
- Comment on the results.
THEORY:-
DC Motor:
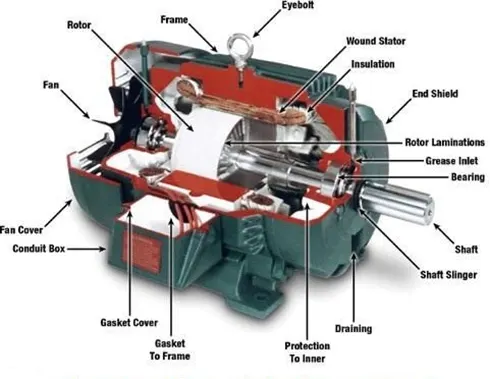
An electric motor operated by DC (direct current) is known as DC motor. A DC motor converts DC electrical energy into mechanical energy. When a current-carrying conductor is placed in a magnetic field, it experiences a torque and has a tendency to move. In other words, when a magnetic field and an electric field interact, a mechanical force is produced. The DC motor or direct current motor works on that principle. This is known as motoring action. The direction of rotation of this motor is given by Fleming’s lefthand rule. which states that if the index finger, middle finger, and thumb of your left hand are extended mutually perpendicular to each other and if the index finger represents the direction of the magnetic field, middle finger indicates the direction of the current, then the thumb represents the direction in which force is experienced by the shaft of the DC motor.
Pulse width modulation:
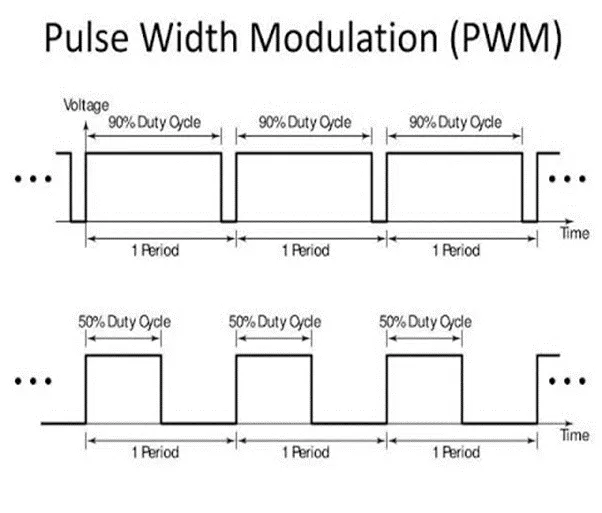
Pulse width modulation (PWM) is a modulation technique that generates variable-width pulses to represent the amplitude of an Analog input signal. The length of time that a pulse is in a given state (high/low) is the "width" of a pulse wave.
Pulse Width Modulation, or PWM, is a technique for getting Analog results with digital means. Digital control creates a square wave, a signal switched between on and off. This on-off pattern can simulate voltages in between full-on and off by changing the portion of the time the signal spends on versus the time that the signal spends the duration of "on time" is called the pulse width. To get varying Analog values, we change or modulate, that pulse width.
H-Bridge Circuit:
H-bridge: In general an H-bridge is a rather simple circuit, containing four switching element, with the load at the center, in an H-like configuration.
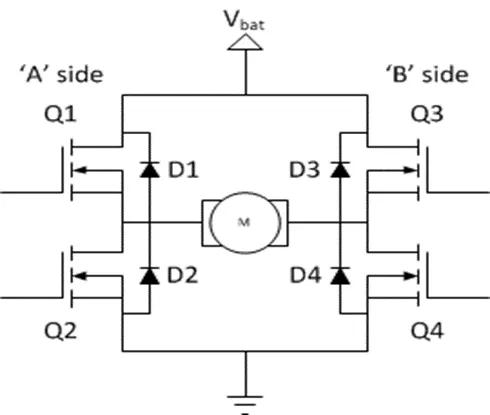
The basic operation of the H-bridge circuit diagram are given below.
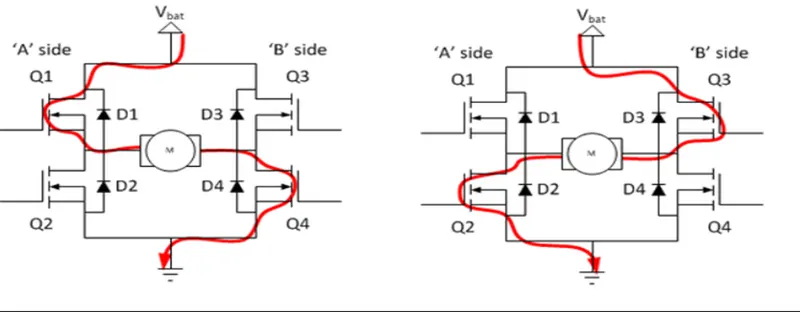
When the positive gate signal is given the switches Q1 and Q4 are turn-on and the motor rotates in forward direction. D1 and D4 are in off condition. During changing of the positive to negative time period the D1 and D4 are in on condition at that time switch Q1 and Q4 are off condition.
When the negative gate signal is given the switch Q3 and Q2 are turn-on and the motor rotates in reverse direction and D3 and D4 are in off condition. During changing of the negative to positive time period the D2 and D3 are in on condition at that time the Q3 and Q4 are off condition. We cannot trigger the two switches of the same leg. It creates a low resistance path and switches gets damaged.
Load characteristics:
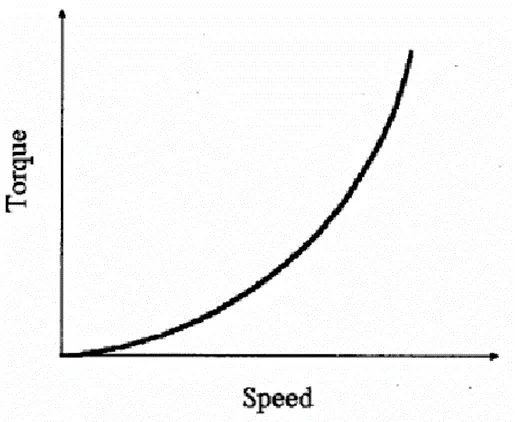
The torque speed curve of a load is a plot showing its torque requirement on the y-axis versus the speed on the x-axis. It’s the torque requirement of the load from zero speed to full speed. It is application/load specific and varies with different load types.
The torque at the load will be proportional to the square of the speed.
T ∝ ω^2
T = K ω^2
DESCRIPTION:-
VARIOUS BLOCKS USED IN PWM CONTROLLED DC MOTOR
Controlled voltage source:
The Controlled Voltage Source block represents an ideal voltage source that is powerful enough to maintain the specified voltage at its output regardless of the current flowing through the source. The output voltage is V = Vs, where Vs is the numerical value presented at the physical signal port.
Controlled PWM voltage block:
The Controlled PWM Voltage block represents a pulse-width modulated (PWM) voltage source. The ports represented as;
Electrical input ports — The block calculates the duty cycle based on the reference voltage across its ref+ and ref- ports. This modelling variant is the default.
PS input — Specify the duty cycle value directly by using an input physical signal port.
H – bridge:
The block can be driven by the Controlled PWM Voltage block in PWM or Averaged mode. In PWM mode, the motor is powered if the PWM port voltage is above the Enable threshold voltage. In Averaged mode, the PWM port voltage divided by the PWM signal amplitude parameter defines the ratio of the on-time to the PWM period. Using this ratio and assumptions about the load, the block applies an average voltage to the load that achieves the correct average load current. The Simulation mode parameter value must be the same for the Controlled PWM Voltage and H-Bridge blocks
Current sensor:
The block represents an ideal current sensor, that is, a device that converts current measured in any electrical branch into a physical signal proportional to the current. Connections + and - are conserving electrical ports through which the sensor is inserted into the circuit. Connection I is a physical signal port that outputs current value.
Voltage sensor:
The block represents an ideal voltage sensor, that is, a device that converts voltage measured between any electrical connections into a physical signal proportional to the voltage. Connections + and - are conserving electrical ports through which the sensor is connected to the circuit. Connection V is a physical signal port that outputs voltage value.
DC motor:
This block represents the electrical and torque characteristics of a DC motor. The block assumes that no electromagnetic energy is lost, and hence the back-emf and torque constants have the same numerical value when in SI units. Motor parameters can either be specified directly, or derived from no-load speed and stall torque. If no information is available on armature inductance, this parameter can be set to some small non-zero value. When a positive current flows from the electrical + to - ports, a positive torque acts from the mechanical C to R ports. Motor torque direction can be changed by altering the sign of the back-emf or torque constants.
Ideal rotational motion sensor:
This block measures angular velocity or angle in a mechanical rotational network. The sensor is ideal since it does not account for inertia, friction, delays, energy consumption, and so on.
The physical signal ports W and A report the angular velocity and angle, respectively, of port R relative to port C. The measured angular velocity is positive when the angular velocity at port R is greater than the angular velocity at port C.
Ideal torque source:
The block represents an ideal source of torque that generates torque at its terminals proportional to the input physical signal. The source is ideal in a sense that it is assumed to be powerful enough to maintain specified torque regardless of the angular velocity at source terminals. Block connections R and C are mechanical rotational conserving ports. Port S is a physical signal port, through which control signal that drives the source is applied. Positive signal at port S generates torque acting from C to R.
Goto:
Send signals to From blocks that have the specified tag. If tag visibility is 'scoped', then Goto Tag Visibility block must be used to define the visibility of the tag. The block icon displays the selected tag name (local tags are enclosed in brackets, [], and scoped tag names are enclosed in braces, {}).
From:
Receive signals from the Goto block with the specified tag. If the tag is defined as 'scoped' in the Goto block, then a Goto Tag Visibility block must be used to define the visibility of the tag. After 'Update Diagram', the block icon displays the selected tag name (local tags are enclosed in brackets, [], and scoped tag names are enclosed in braces, {}).
SIMULINK MODEL EXPLANATION:
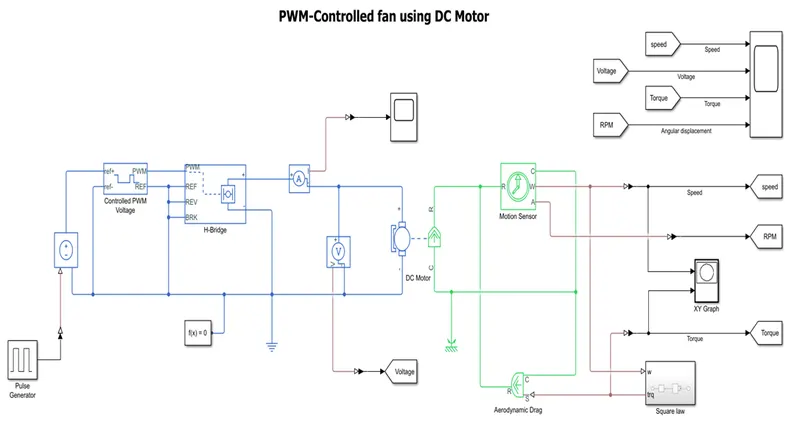
The fig above depicts the Simulink model for PWM controlled fan load using DC motor. The input cycle produced from the pulse generator produced is given to controlled voltage source port.
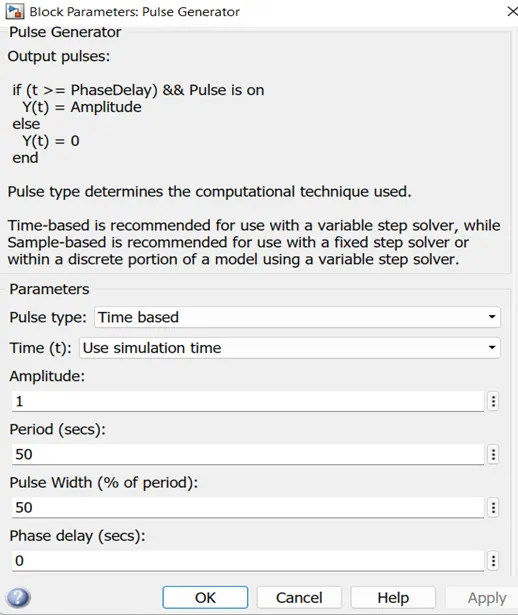
The pulse generator parameters as shown below;
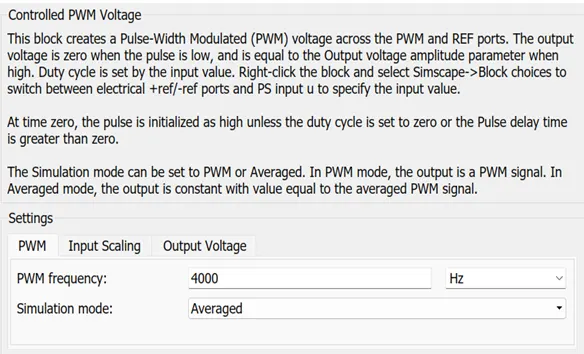
The positive port of the controlled voltage is connected to ref+ port of the controlled PWM voltage and negative port to ref- port of PWM controlled voltage source. The stimulation mode of PWM voltage source is taken averaged. The other data are given in the block are given below;
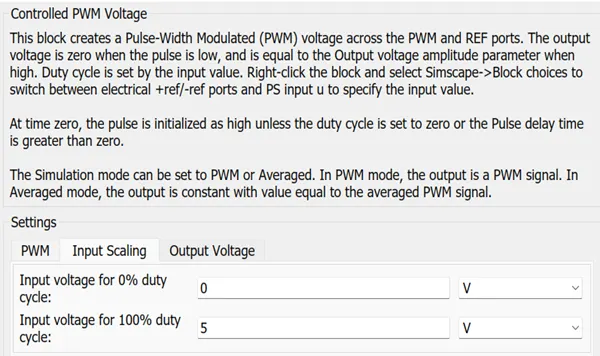
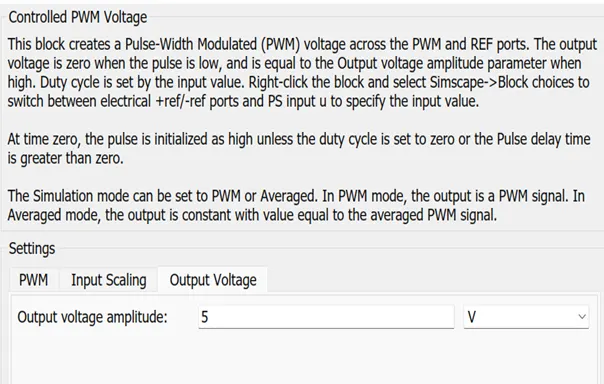
The PWM port of the controlled PWM voltage is directly connected to PWM port of the H-bridge. The REF port of the controlled PWM voltage is taken common for REF, REV and BRK port of the H bridge. The H bridge parameters are given below;
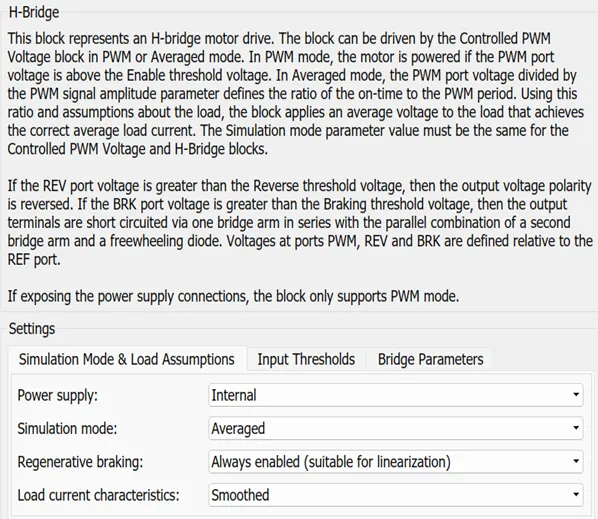
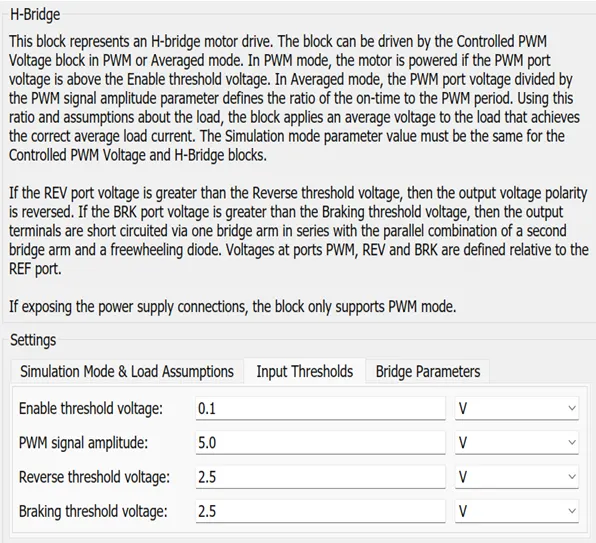
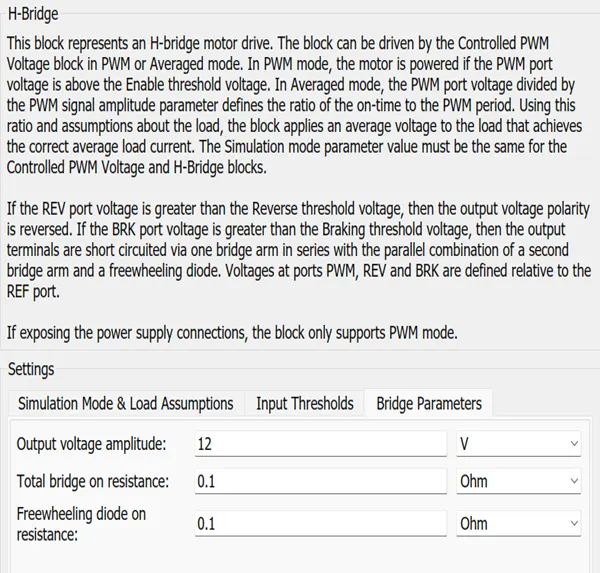
The positive terminal of the H-bridge block is connected to the positive of the current sensor and the negative terminal of H-bridge is connected to the negative terminal of the voltage sensor. The current sensor and the voltage sensor are then connected in series. The V-port of the voltage sensor is connected to a PS-Simulink converter and then to a goto block titled ‘Voltage’.
Then, the DC motor block is taken in series with the voltage and current sensors and its following parameters are given below;
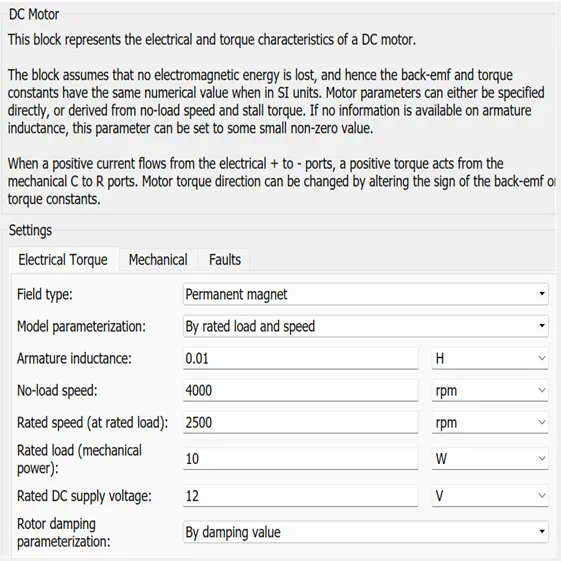
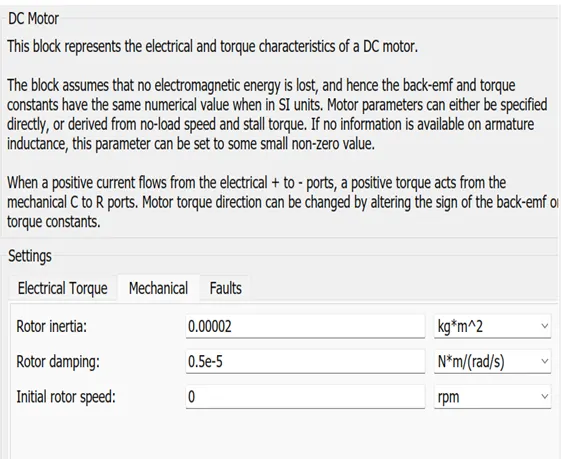
The R-port of the DC motor block is connected to the R-port of the ideal rotational motion sensor bock and the C-port of the Dc motor is connected to the C-port of the ideal rotational sensor block.
The ideal rotational motion sensor has one input port: R and three output ports: C, W and A. Here, the R-port of the ideal motion sensor is connected to the R-port of the ideal torque source and similarly, the C-port of the ideal motion sensor is connected to the C-port of the ideal torque sensor block. The W-port of the ideal motion sensor is connected to the fan load.
The fan load is taken as a subsystem with the formula: T= K ω^2. Within the subsystem, a PMC port is taken as w (ω) which is connected to a PS product block. From the PS product block, it is then connected to PS gain block having the value 8.8*e^-8 N*m/(rad/s) ^2 and then given to an output PMC port taken as trq (torque). The figure is given below;
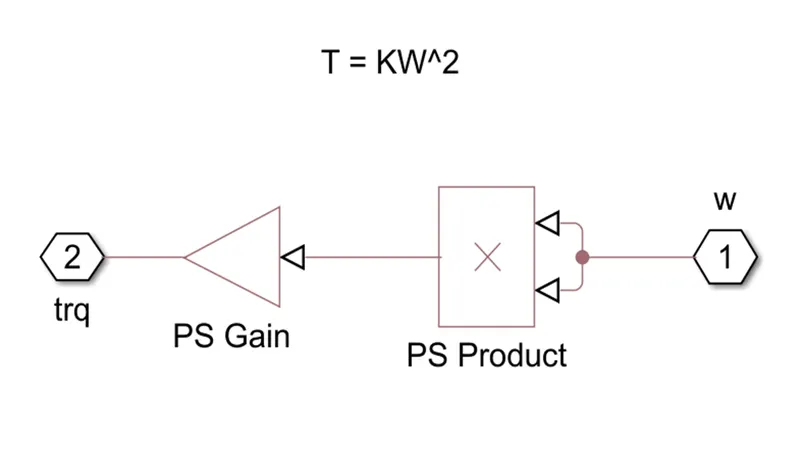
The W-port of the fan load is connected to the W port of the subsystem and the trq port of the subsystem is connected to C-port of the ideal torque sensor.
The W-port of the ideal motion sensor is connected to a PS-simulink converter and then to a goto block titled ‘Speed’. The A-port of the ideal motion sensor is connected to a PS-simulink converter and then to a goto block titled ‘Angular displacement’. And lastly, the trq port of the subsystem is connected to a PS-simulink converter and then to a goto block titled ‘Torque’.
An XY graph block is taken from the W-port of the ideal motion sensor and the trq port of the subsystem. The XY graph block parameters are given below;
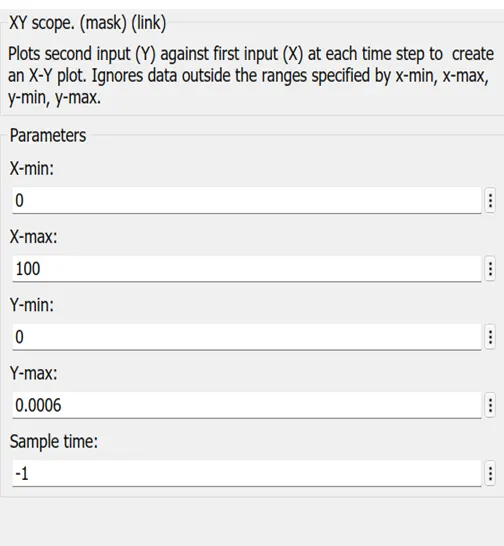
Then, at last the from blocks of the respective goto blocks are taken and given to a scope to check the necessary results.
A solver configuration is taken into account for the proper simulation of the above Simulink model.
OBSERVATIONS:-
Here, as per our objective we take into account the speed, voltage, angular displacement, current and the torque with respect to time plots for a Simulink model of PWM controlled fan load using DC motor. Also, the Torque Vs Speed plot is also taken into account;
Speed Vs time, Voltage Vs time, Angular displacement Vs time and the Torque Vs time plots for a PWM controlled fan load using DC motor:
In the figure given below the Speed Vs time, Voltage Vs time, Angular displacement Vs time and the Torque Vs time graphs are plotted;
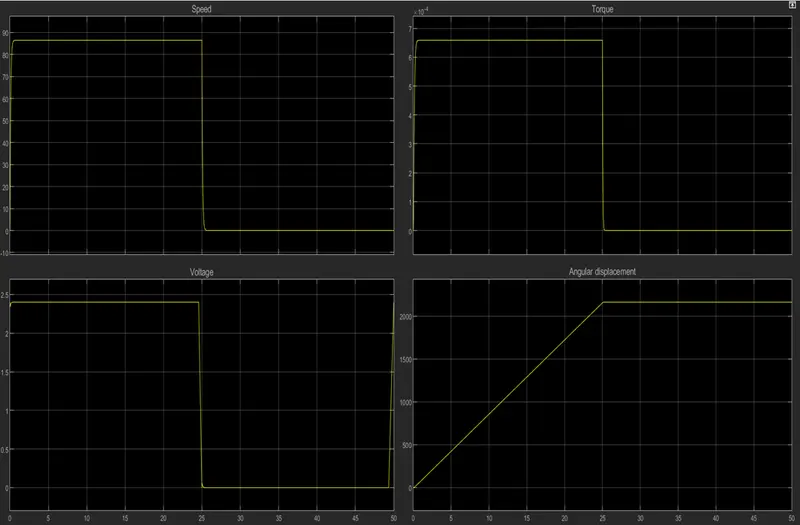
In the Speed Vs time plot of a PWM controlled fan load using DC motor, the speed increases from 0 to 86.5 rad/sec at approximately 1 sec and remains constant till 25 sec. At the 25 sec mark, it decreases rapidly to 0 and becomes constant for the rest of the time.
In the Torque Vs time plot of a PWM controlled fan load using DC motor, the torque increases from 0 to 6.5*10^-4 N-m at approximately 1 sec and remains constant till 25 sec. At the 25 sec mark, it decreases rapidly to 0 and remains constant for the rest of the time.
In the Voltage Vs time plot of a PWM controlled fan load using DC motor, the voltage remains constant at 2.4 V till 25 sec. At 25 sec, it decreases rapidly to 0 and remains constant till 49 sec and increases rapidly again to the 2.4 V level.
In the Angular displacement Vs time plot of a PWM controlled fan load using DC motor, the angular displacement increases linearly from 0 to 2160 rad at 25 sec and remains constant for the rest of the time.
Current Vs time plot for a PWM controlled fan load using DC motor:
The curent Vs Time plot is given below;
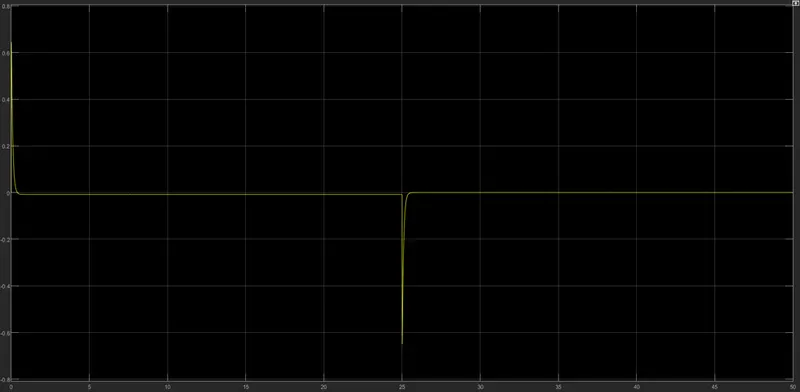
In the Current Vs time plot of a PWM controlled fan load using DC motor, the current decreases from 0.64A to 0 and remains 0 till 25 sec and at the 25 sec, it goes to the negative half with the value -0.64A and increases to 0 and remains constant till the rest of the time.
Torque Vs Speed plot for a PWM controlled fan load using DC motor:
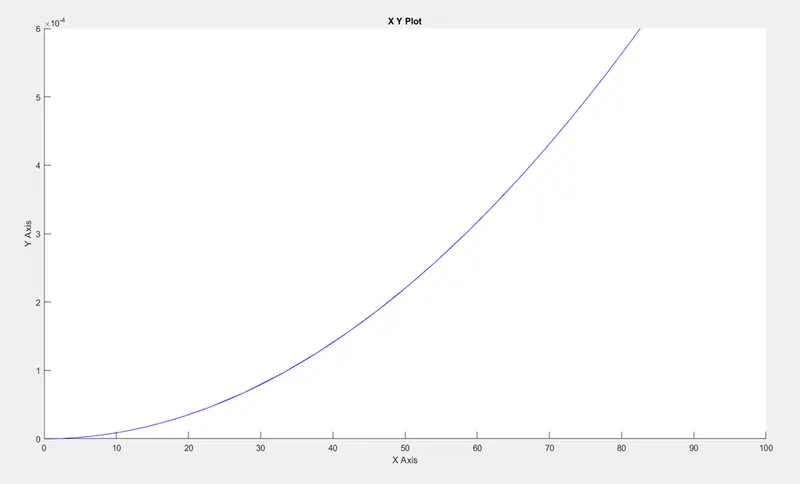
The Torque-speed plot is given below as an XY plot, where in the X-axis, speed is taken and in Y-axis, torque is taken.
The Torque-speed curve of a load is a plot showing its torque requirement on the y-axis versus the speed on the x-axis. It’s the torque requirement of the load from zero speed to full speed.
The torque at the load will be proportional to the square of the speed.
CONCLUSION:-
Simulink model of PWM controlled fan load using DC motor is created and the various Speed Vs time, Voltage Vs time, Angular displacement Vs time, Torque Vs time, Current Vs time graphs are plotted, and also characterized the Torque-speed curve.
REFERENCES:-
https://www.researchgate.net/publication/338116979_DC_Motor_Speed_Control_Using_PWM
https://www.iitp.ac.in/~siva/2020/ee280/DC_Machines.pdf
https://www.egr.msu.edu/classes/ece480/capstone/spring11/group03/App%20Note.pdf