Project - Data Handling and Interpolation
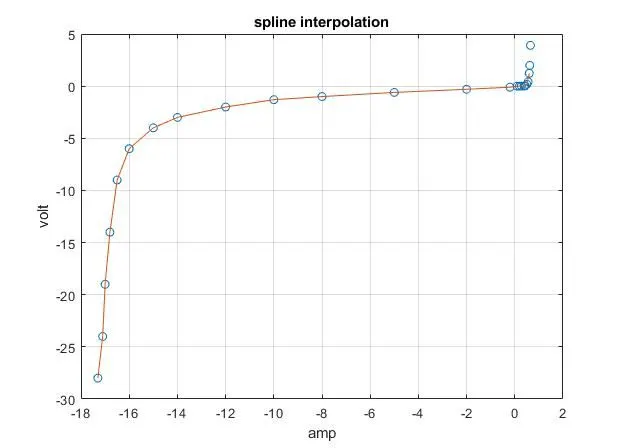
Q1. In a laboratory experiment, data of voltage and current has been recorded and the same is attached in an excel file ( VI.xlsx ). Read the excel file in the Matlab program and perform the interpolation in the range of -17.3:0.1:0.9. Generate the interactive plot for the interpolated data. Additionally, compute the current values for given voltages below and store them in a text file.
VV =[-17.2 -17.1 -13.8 -13.5 -13.0 -12.5 -11 -9 -5.76 -6 -1 0.11 0.25 0.5 0.61]’
SOLUTION:
[data] = xlsread('volt_amp.xlsx'); %reading the data xl sheet
v=data(:,1);
i=data(:,2);
vq=(-17.3:0.1:0.9); %declaring the range
iq1=interp1(v,i,vq); %performing interpolation
figure(1);
plot(v,i,'o',vq,iq1); %ploting interpolated data
xlabel('amp');
ylabel('volt');
grid;
title('spline interpolation');
vv=[-17.2; -17.1; -13.8; -13.5; -13.0; -12.5; -11; -9; -5.76; -6; -1; 0.11; 0.25; 0.5; 0.61;]; %declaring the given data
iq2=interp1(v,i,vv); %interpolating the given data
t=[vv iq2];
writematrix(t,'result.txt'); %saving output in a text file