Project - Data Handling and Interpolation
QUESTION 1-V_I=xlsread('VI.xlsx') % read excel file
V=V_I(:,1);% create voltage matrix
I=V_I(:,2);% create current matrix
xq=-17.3:0.1:0.9; % interpolation range
yq=interp1(V,I,xq); % performing interpolation in the range xq
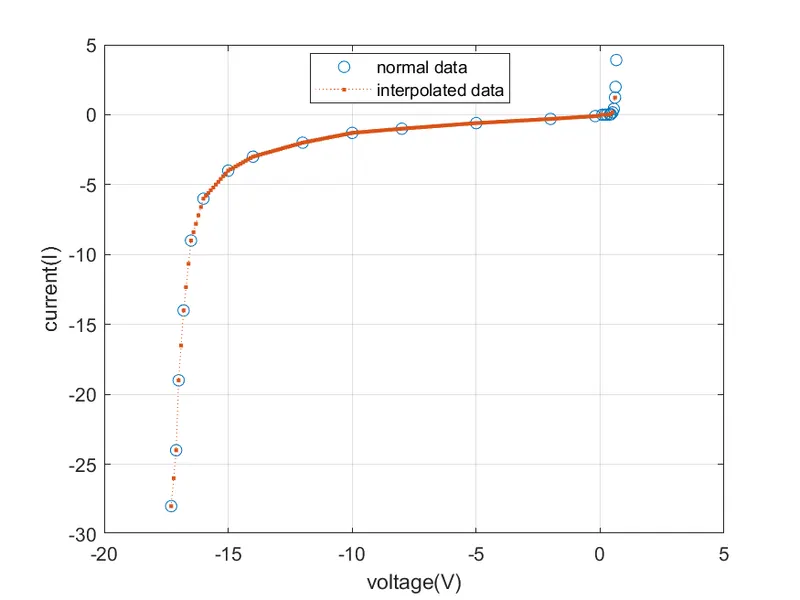
plot(V,I,'o',xq,yq,':.');grid on; %plotting graph 'V' vs 'I' for both normal and interpolated data
xlabel('voltage(V)');ylabel('current(I)');
%VV =[-17.2 -17.1 -13.8 -13.5 -13.0 -12.5 -11 -9 -5.76 -6 -1 0.11 0.25 0.5 0.61]
%find corresponding current values
i1=interp1(V,I,-17.2);i2=interp1(V,I,-17.1);i3=interp1(V,I,-13.8);i4=interp1(V,I,-13.5);
i5=interp1(V,I,-13);i6=interp1(V,I,-12.5);i7=interp1(V,I,-11);i8=interp1(V,I,-9);
i9=interp1(V,I,-5.76);i10=interp1(V,I,-6);i11=interp1(V,I,-1);i12=interp1(V,I,0.11);
i13=interp1(V,I,0.25);i14=interp1(V,I,0.5);i15=interp1(V,I,0.61);
cal_current=[i1 i2 i3 i4 i5 i6 i7 i8 i9 i10 i11 i12 i13 i14 i15]; %storing all current values corresponding to given voltages
output:
explanation: 1-using xlsread command read the excel file in the program.
2- create voltage and current matrices by taking values from the excel file.
3-create interpolation range in the variable 'xq'
4-using interp1 command interpolates the data and store in variable 'yq'
5-plot the graph and add legend for normal and interpolated data.
6-using interp1 command fetch the current values at the given voltage values.
7-store all current values in the cal_current variable.
8-use diary command the in the command window store the cal_crrent values in the text form (diary calculated current)