Project - Data Handling and Interpolation
Aim:
- In this project, we are reading the excel file into the MATLAB program.
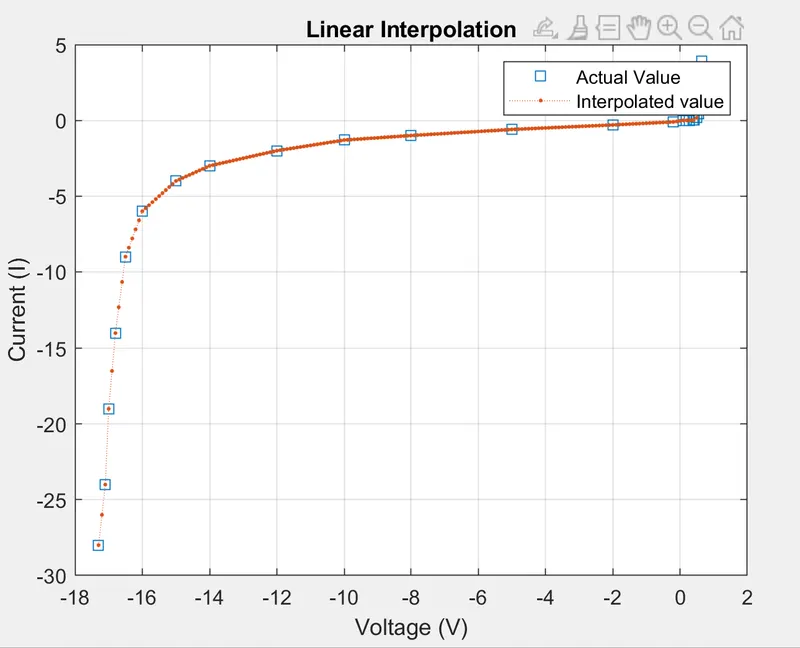
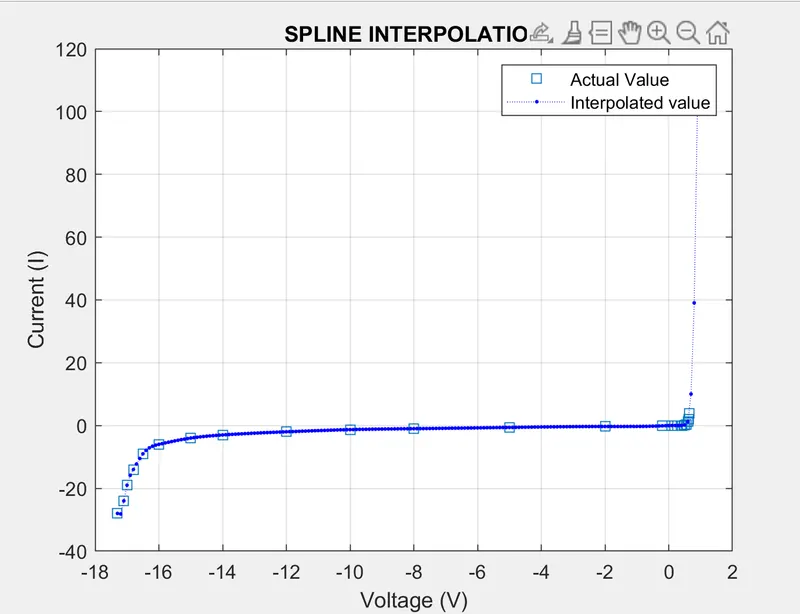
- perform the interpolation in the range of -17.3:0.1:0.9
- Generate the interactive plot for the interpolated data and store them in a text file.
R=xlsread('VI');  % to read the excel
v=R(:,1); % voltage data seperating
i=R(:,2); % current data seperating
xq=[-17.3:0.1:0.9]; % Given interpolation range
yq1=interp1(v,i,xq); % linear interpolation
yq2=interp1(v,i,xq,'spline'); % spline interpolation
% Linear interpolation plotting
figure(1)
plot(v,i,'s',xq,yq1,': .');
title('Linear Interpolation');
xlabel('Voltage (V)');
ylabel('Current (I)');
legend('Actual Value', 'Interpolated value', 'location','Northeast');
grid on;
% spline interpolation plotting
figure(2)
plot(v,i,'s',xq,yq2,'b: .');
title('SPLINE INTERPOLATION');
xlabel('Voltage (V)');
ylabel('Current (I)');
legend('Actual Value', 'Interpolated value', 'location','Northeast');
grid on;
% saving the interpolation data into text file
%opening text file
VI=fopen('VI_output.txt','w');
fprintf(VI,' Voltage  Current\n');
%writing voltage & current value
fprintf(VI,'%4.3f  %5.3f\n',xq,yq2);
%saving linear interpolation graph
savefig(1,'vilinear.fig');
%saving spline interpolation graph
savefig(2,'vispline.fig');
fclose(VI);