Week 4.1 - Genetic Algorithm
Aim: To study the genetic algorithm and calculate the global maxima for the stalagmite function using the genetic algorithm in Matlab.
objective:
1. To write a code in MATLAB to optimize the stalagmite function and find the global maxima of the function.
2. plot the graph for all the conditions.
3. to study the genetic algorithm and stalagmite functions.
concept of genetic algorithm:
The genetic algorithm is a method for solving both constrained and unconstrained optimization problems that is based on natural selection, the process that drives biological evolution. The genetic algorithm repeatedly modifies a population of individual solutions. At each step, the genetic algorithm selects individuals from the current population to be parents and uses them to produce the children for the next generation. Over successive generations, the population "evolves" toward an optimal solution. You can apply the genetic algorithm to solve a variety of optimization problems that are not well suited for standard optimization algorithms, including problems in which the objective function is discontinuous, nondifferentiable, stochastic, or highly nonlinear. The genetic algorithm can address problems of mixed integer programming, where some components are restricted to be integer-valued.
the genetic algorithm uses three main processes to create a new generation from the current population.
1. selection
2. cross over
3.mutation
- The idea of selection phase is to select the fittest individuals and let them pass their genes to the next generation.
Two pairs of individuals (parents) are selected based on their fitness scores. Individuals with high fitness have more chance to be selected for reproduction.
- Crossover is the most significant phase in a genetic algorithm. For each pair of parents to be mated, a crossover point is chosen at random from within the genes.
- In certain new offspring formed, some of their genes can be subjected to a mutation with a low random probability. This implies that some of the bits in the bit string can be flipped.wor
working process of genetic algorithm

About stalagmite function
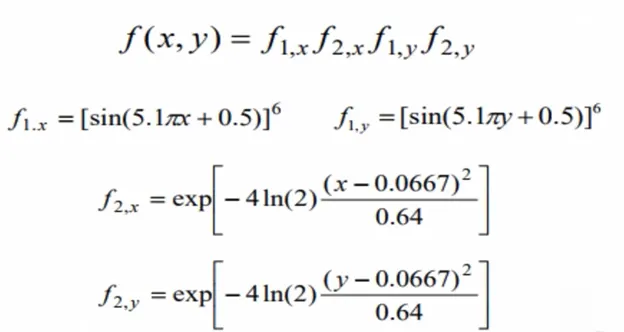
A stalagmite function generally refers to the function with which we are generating values over a stalagmite kind of surface for finding out the local and global maxima and minima of that particular given function.
function is shown below
syntax of genetic algorithm(GA)
x= ga(fun,nvars)
where
x= optimal solution.
fun = objective function
nvars = number of variables
x= ga(fun,nvars,A,b,Aeq,beq, lb,ub,)
where,
A, B = Linear inequality constraints
Aeq, Beq = Linear equality constraints
If there are no linear equalities and inequalities, then A, B, Aeq, Beq are set to ‘[ ].
x=ga(fun,nvars,A,b,Aeq,beq,lb,ub,nonlcon,option)
where,
nonlcon = Nonlinear constraints
options = Optimization options
If there are no nonlinear constraints the nonlcon set to ‘[ ]’.
MATLAB program
first we have to define the stalagmite function.
function [f] = stalagmite(input)
x =input(1);
y= input(2);

f1x = (sin((5.1*pi*x)+0.5))^6;
f1y = (sin((5.1*pi*y)+0.5))^6;
f2x= exp(-4*log(2)*(((x-0.0667)^2)/0.64));
f2y= exp(-4*log(2)*(((y-0.0667)^2)/0.64));

f=-(f1x*f1y*f2x*f2y);
end
end
The negative sign will invert the plot of function maximum.
program
clear all
close all
clc

% inputs of variables
x=linspace(0,0.6,150); % x array
y = linspace(0,0.6,150); % y array
n=50;                    % number of iterations
% creating of 2d mesh
[xx,yy] = meshgrid(x,y);

% evaluation of the function
for i = 1:length(x)
    for j= 1:length(y)
        input(1) =xx(i,j);
        input(2)= yy(i,j);
        f(i,j)= stalagmite(input);
    end
end

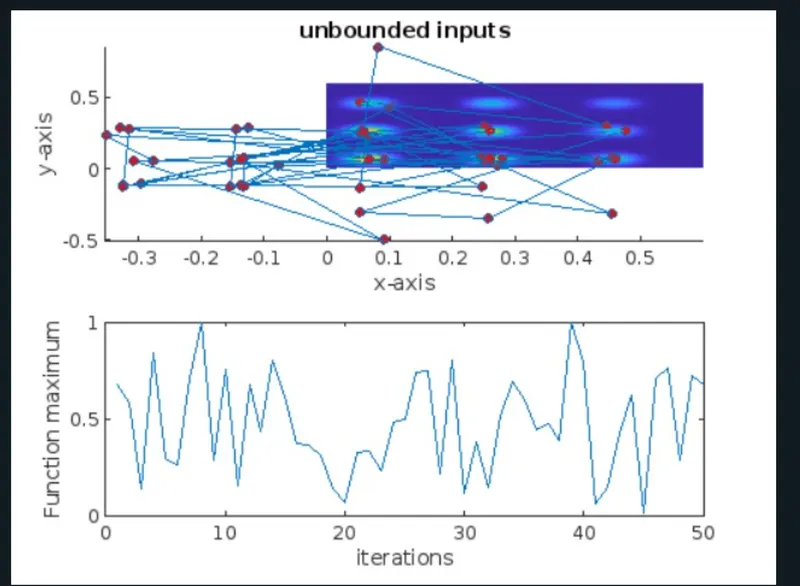
% case1 study of unbounded behaviour

tic
for i=1:n
    [input, fopt(i)] = ga(@stalagmite,2);
    xopt(i) = input(1);
     yopt(i)= input(2);

end
study_time= toc

figure(1)
subplot(2,1,1)
 hold on
 surf(x,y,-f)
 shading interp

 xlabel('x-axis')
 ylabel('y-axis')
 title(' unbounded inputs')
 plot3(xopt,yopt,-fopt,'marker','o','markersize',6,'markerfacecolor','r')
 subplot(2,1,2)
 plot(-fopt)
 xlabel('iterations')
 ylabel('Functon maximum')

 % case2 lower and upper bounds

 tic
 for i=1:n
     [inputs,fopt(i)]=ga(@stalagmite,2,[],[],[],[],[0;0],[0.4;0.4]);
     xopt(i)=input(1);
     yopt(i)=input(2);
 end
 study_time =toc

 figure(2)

  subplot(2,1,1)
  hold on

 surf(x,y,-f)
shading interp
xlabel('x-axis')
 ylabel('y-axis')
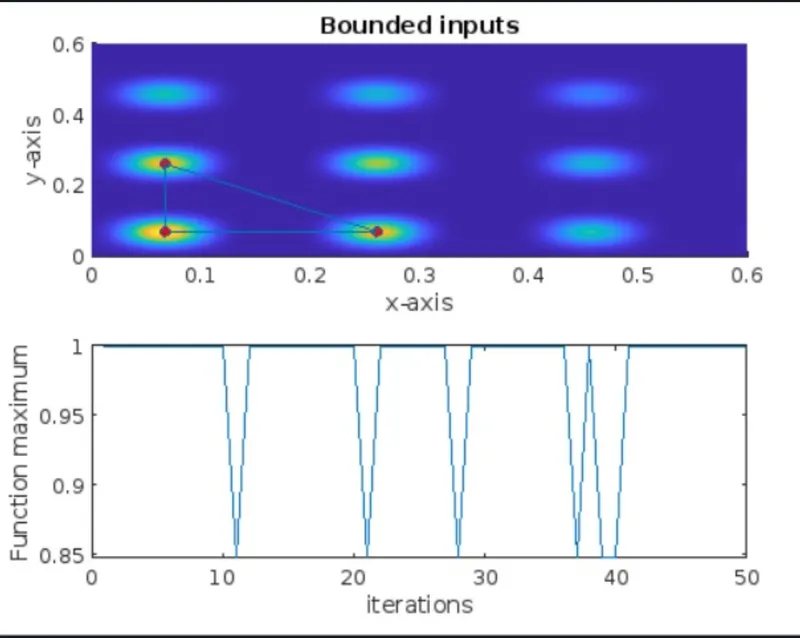
 title('Bounded inputs')
 plot3(xopt,yopt,-fopt,'marker','o','markersize',6,'markerfacecolor','r')
 subplot(2,1,2)
 plot(-fopt)
  xlabel('iterations')
 ylabel('Functon maximum')

 % case 3 with increasing the number of iteration of GA

 options= optimoptions('ga');
 options= optimoptions(options,'PopulationSize',270);
 tic

 for i= 1:n
     [inputs,fopt(i)]= ga(@stalagmite,2,[],[],[],[],[0;0],[0.4;0.4],[],[],options);
     xopt(i)= input(1);
     yopt(i)= input(2);
 end
 study_time = toc

 figure(3)
 subplot(2,1,1)
 hold on

 surf(x,y,-f)
 shading interp

 xlabel('x-axis')
 ylabel('y-axis')
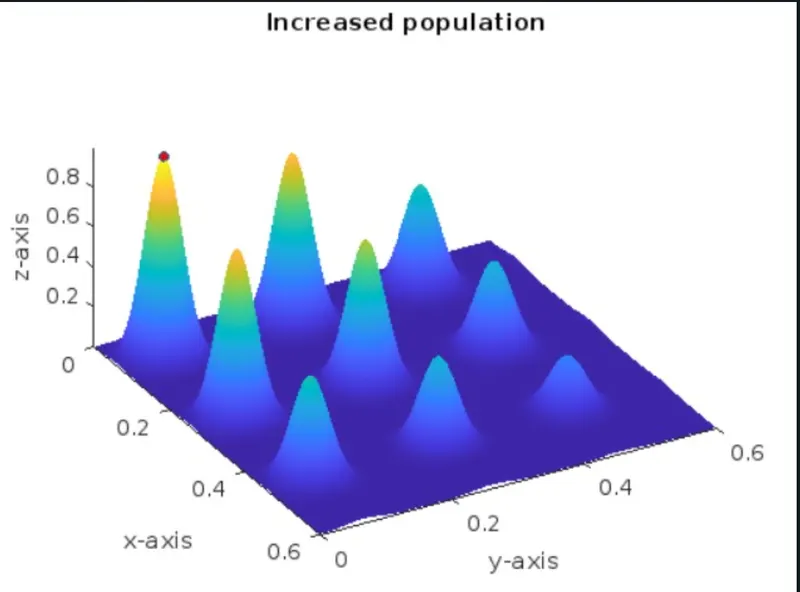
 title('Increased population')
 plot3(xopt,yopt,-fopt,'marker','o','markersize',6,'markerfacecolor','r')
 subplot(2,1,2)
 plot(-fopt)
 xlabel('iterations')
 ylabel('Functon maximum')
code explanation
- The code starts with clear all, close all and clc where,
- Then the ‘x’ array and ‘y’ array is defined using ‘linspace’ command to create values at 150 equal intervals.
- A 2D mesh of x and y array is created by using ‘meshgrid’ command and the number of iterations or cases that the code should perform is defined. This is given by n = 50.
- To evaluate the stalagmite function, ‘for’ loop is used where ‘i’ is initialized and for every value of ‘i’ another ‘for’ loop is used to initialize ‘j’.
- The input vector values of ‘xx’ and ‘yy’ are defined and the stalagmite function for these input vector is defined.
- next step is to creating the 3 cases of GA they are unbounded, bounded and increase the population size.
- This is done using ‘for’ loop where we use ‘ga’ syntax to give values for inputs and optimum max value. The stalagmite function is called in ‘ga’ syntax and number of variables ‘nvars’ are 2.
- To know the time that is taken to solve the loop for 50 iterations, ‘tic’ and ‘toc’ command is used before and after the loop respectively.
- Then the function created in the loop is plotted by using ‘surf’ command for ‘x, y and function output’. To neglect the gridlines on the surface and obtain a smooth and clean plot, ‘shading interp’ command is used. The ‘subplot(2,1,1)’ is used to plot multiple plots on same figure which also divides figure in grid of 2x1 and axes to be placed at 1.
- The ‘plot3’ command plots the 3D points at ‘xopt, yopt and optimum value of function’ with ‘o’ shaped and red colour. The labels and title are then provided. Now in the same figure, the values of optimum function ‘fopt’ are plotted for 50 iterations.
- The results of the above case will be different for each time we run the program. To get same value each time, we need to restrict the program within specific bounds namely upper bound and lower bound. The procedure for coding and plotting this procedure is same as Study 1. The only difference is in the ‘ga’ syntax. This time the algorithm is provided lower limits and upper limits as [0;0] and [1;1] respectively.
- After plotting the results for Study 2 or the bounded case, it is observed that the results are not same every time the program terminates. A solution to this problem is to increase the number of cases or iterations.
- So for Study 3, the number of iterations are increased to 270. So for this study, the syntax, “options = optimoptions(‘SolverName’,’Name’,‘Value’)” is used which returns with named parameter ‘Populations’ with the altered values ‘270’.
- The syntax for ‘ga’ contains ‘option’ term and the rest of the code is same as for Study 1 and 2.
error:
a small error like for populationsize that is use capaital P & S.
Result:
case1: study on unbounded behaviour
case2: study on bounded behaviour
case3: study on increasing number of iterations.
conclusion:
from the above case study we obtained the maximum function value .