Project - Data Handling and Interpolation
Project
- In a laboratory experiment, data of voltage and current has been recorded and the same is attached in an excel file ( Click on this link VI.xlsx ).
- Read the excel file in the Matlab program and perform the interpolation in the range of -17.3:0.1:0.9.
- Generate the interactive plot for the interpolated data and store them in a text file.
Matlab code:
% perform the interpolation in the range of -17.3:0.1:0.9.
clc
Fid = xlsread('VI.xlsx'); % Reading the Excel file
V = Fid(:,1); % column A for voltage
I = Fid(:,2); % column B for current
V1 = -17.3:0.1:0.9; % set the voltage range given
Vq1 = interp1(V,I,V1);
Vq2 = interp1(V,I,V1,'spline');
figure(1);
plot(V,I,'o',V1,Vq1,':.'); % plot linear interpolation
xlabel('V (volt)')
ylabel('I (mAmp)')
grid
title('Linear interpolation (default)'); % title for plot
figure(2)
plot(V,I,'o',V1,Vq2,':.'); % plot spline interpolation
xlabel('V (volt)')
ylabel('I (mAmp)')
grid
title('spline interpolation'); % title to figure 2
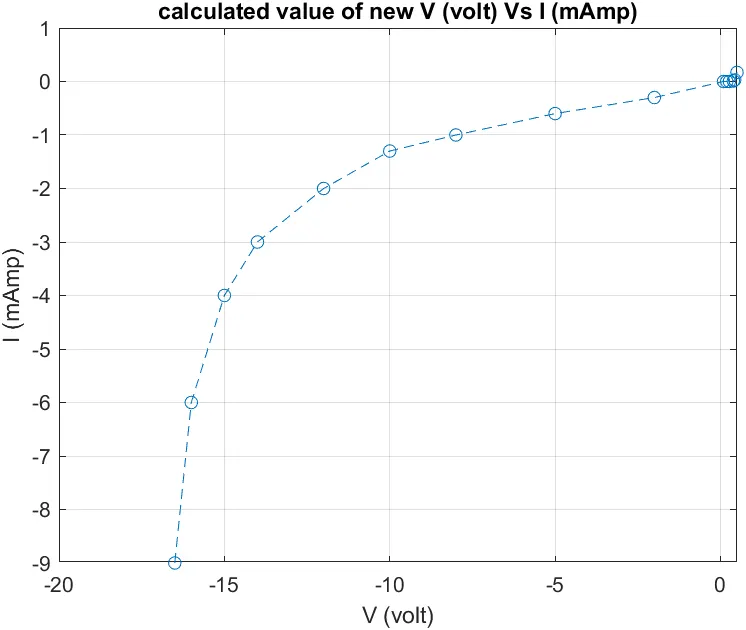
Vr = [-16.5,-16,-15,-14,-12,-10,-8,-5,-2,0.09,0.19,0.27,0.39,0.43,0.5];% new Voltage range
I2 = interp1(V,I,Vr); % linear interpolation for find value of current;
figure(3)
plot(Vr,I2,'o--') % plot linear interpolation of new voltage and current value
xlabel('V (volt)')
ylabel('I (mAmp)')
grid
title('calculated value of new V (volt) Vs I (mAmp)') % title for new valuess
Y = fopen('Project1.txt','w'); % open the text file to write
for i = 1:len % index i variable representing looping counter len
fprintf(Y,'%.3f %.3f'\n,Vr(i),I2(i)); %storing the value into the variable Y
end
fclose(Y); %close the file
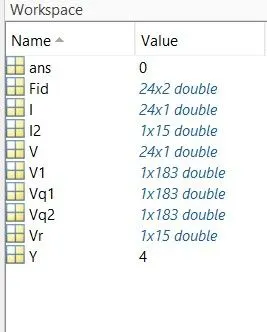
Workspace:
Figure(1):
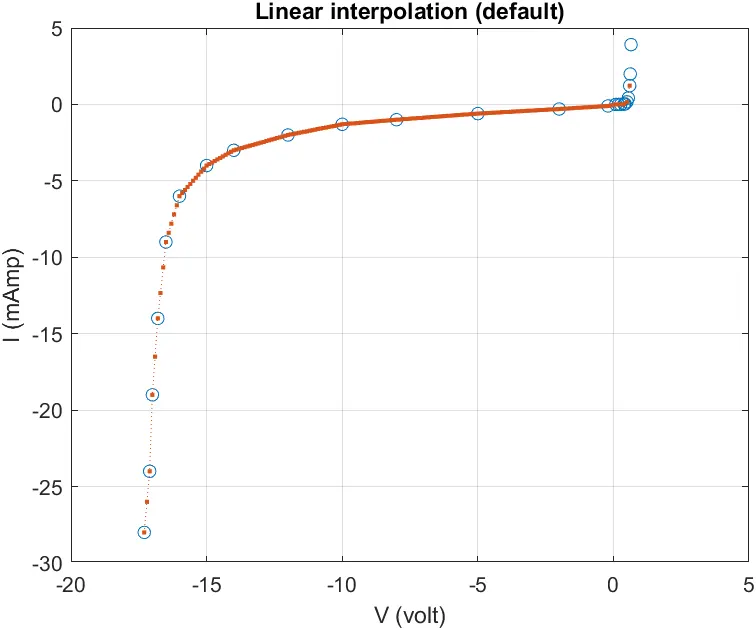
Figure (2):
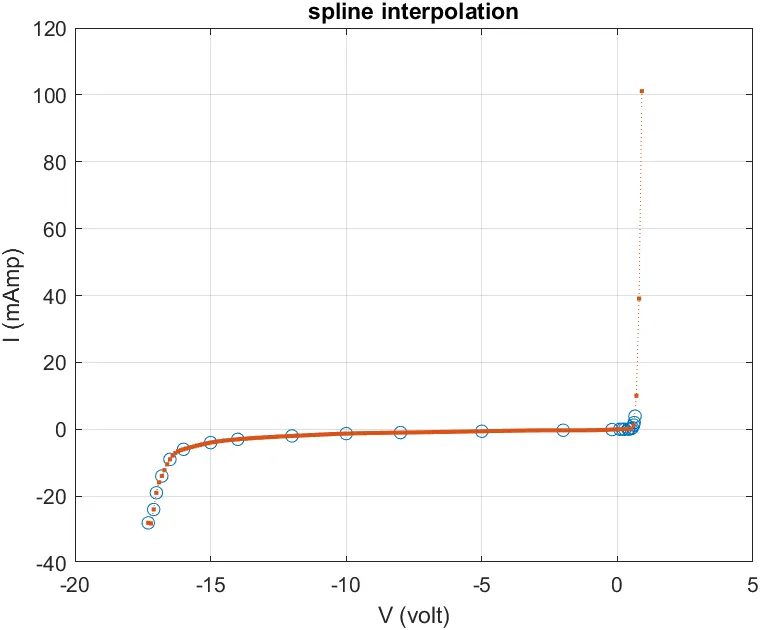
Figure (3):
Hence, we Successively done laboratory experiment, data of voltage and current has been recorded which is attached in an excel file ( Click on this link VI.xlsx ).
Read the excel file in the Matlab program and performed the interpolation in the range of -17.3:0.1:0.9.
Generated the interactive plots for the interpolated data and store them in a text file.