Project - Data Handling and Interpolation
Ans;
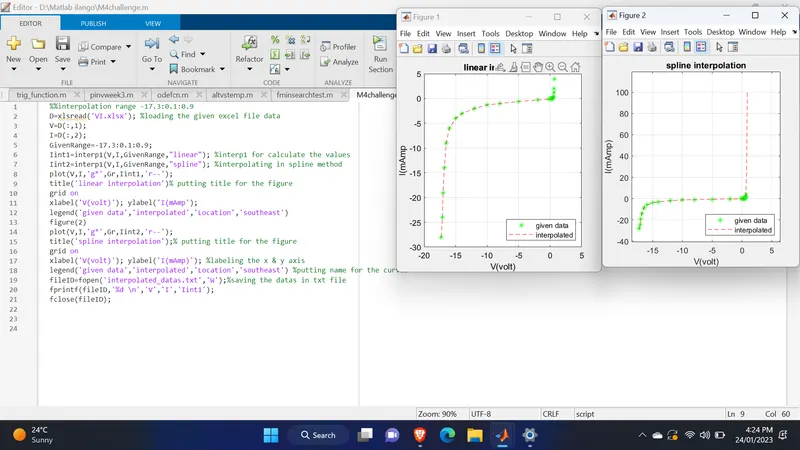
%%interpolation range -17.3:0.1:0.9
D=xlsread('VI.xlsx'); %loading the given excel file data
V=D(:,1);
I=D(:,2);
GivenRange=-17.3:0.1:0.9;
Iint1=interp1(V,I,GivenRange,"linear"); %interp1 for calculate the values
Iint2=interp1(V,I,GivenRange,"spline"); %interpolating in spline method
plot(V,I,'g*',Gr,Iint1,'r--');
title('linear interpolation')% putting title for the figure
grid on
xlabel('V(volt)'); ylabel('I(mAmp');
legend('given data','interpolated','Location','southeast')
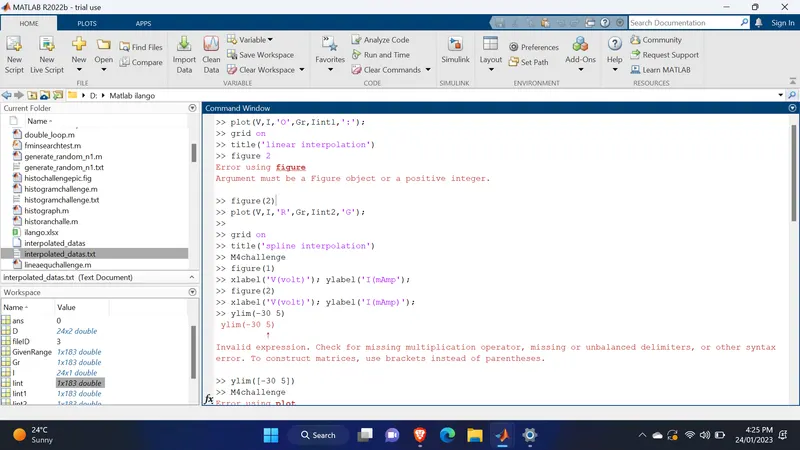
figure(2)
plot(V,I,'g*',Gr,Iint2,'r--');
title('spline interpolation');% putting title for the figure
grid on
xlabel('V(volt)'); ylabel('I(mAmp)'); %labeling the x & y axis
legend('given data','interpolated','Location','southeast') %putting name for the curves
fileID=fopen('interpolated_datas.txt','W');%saving the datas in txt file
fprintf(fileID,'%d \n','V','I','Iint1');
fclose(fileID);