Project - Data Handling and Interpolation
ans =
clc
clear all
close all
data = xlsread("project4.xlsx") %given xlsresad command to read the given file
V= data(:,1); %voltage value acording to the given sheet
I= data(:,2); % I values in the given sheet
xq = -17.3:0.1:0.9; %range
plot(V,I,'r+') %plotting of xq,y1
hold on
y1 = interp1(V,I,xq); %using interpolation command
plot(xq,y1,"b*") %plotting of xq,y1,
filename = fopen("project41.txt",'w') %saving file in text file
fprintf(filename,'%f\n ', y1);
fclose(filename);
result :
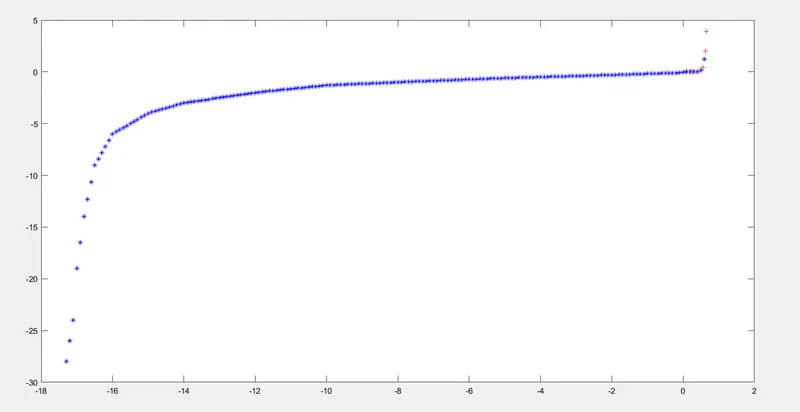
In ths project, it comprises of certain commands like interp1, where it helps to plot the unknown values between the selected range /values.
initial values of V,I represented with redcolur+ signs whereas, interpolation is with blue coloured * sign.