Project - Data Handling and Interpolation
M=xlsread('VI.xlsx'); % Reading Xcel file
V=M(:,1); % Reading Voltage value out of xcel sheet
I=M(:,2); % Reading Current value out of xcel sheet
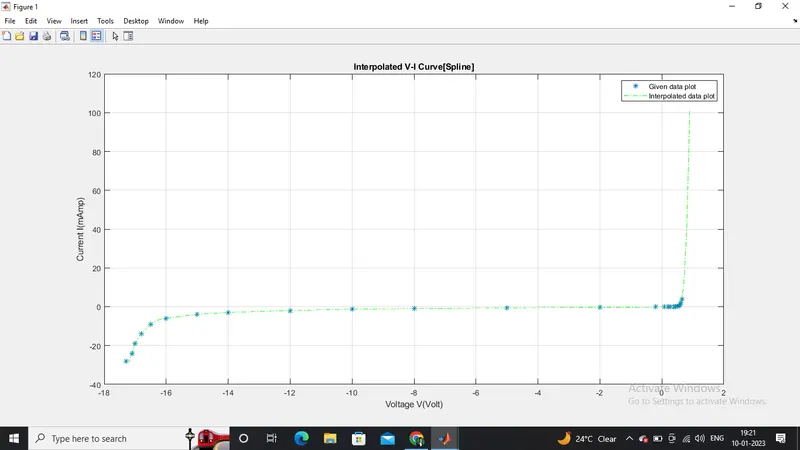
%% Spline Interpolation
figure(1)
plot(V,I,'*');
hold on;
Vh=-17.3:0.1:0.9; %Interpolation inputs
Ih=interp1(V,I,Vh,'spline'); % spline interpolation
plot(Vh,Ih,'g-.');
grid;
title('Interpolated V-I Curve[Spline]');
legend('Given data plot','Interpolated data plot');
xlabel('Voltage V(Volt)');
ylabel('Current I(mAmp)');
hold off;
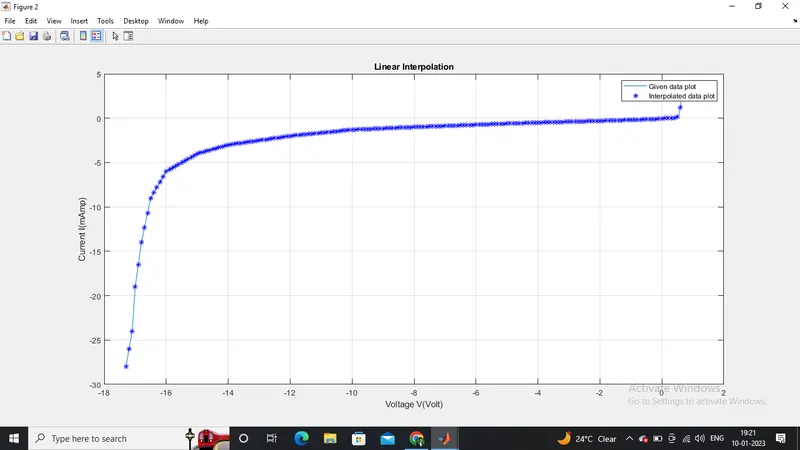
%% Linear interpolation
Ih2=interp1(V,I,Vh,'linear'); % Linear interpolation
figure(2)
plot(V,I,Vh,Ih2,'b*');
grid on
title ('Linear Interpolation')
legend('Given data plot','Interpolated data plot');
xlabel('Voltage V(Volt)');
ylabel('Current I(mAmp)');
z=[Vh' Ih' Ih2'];
writematrix(z,'Project.txt');