Project - Data Handling and Interpolation
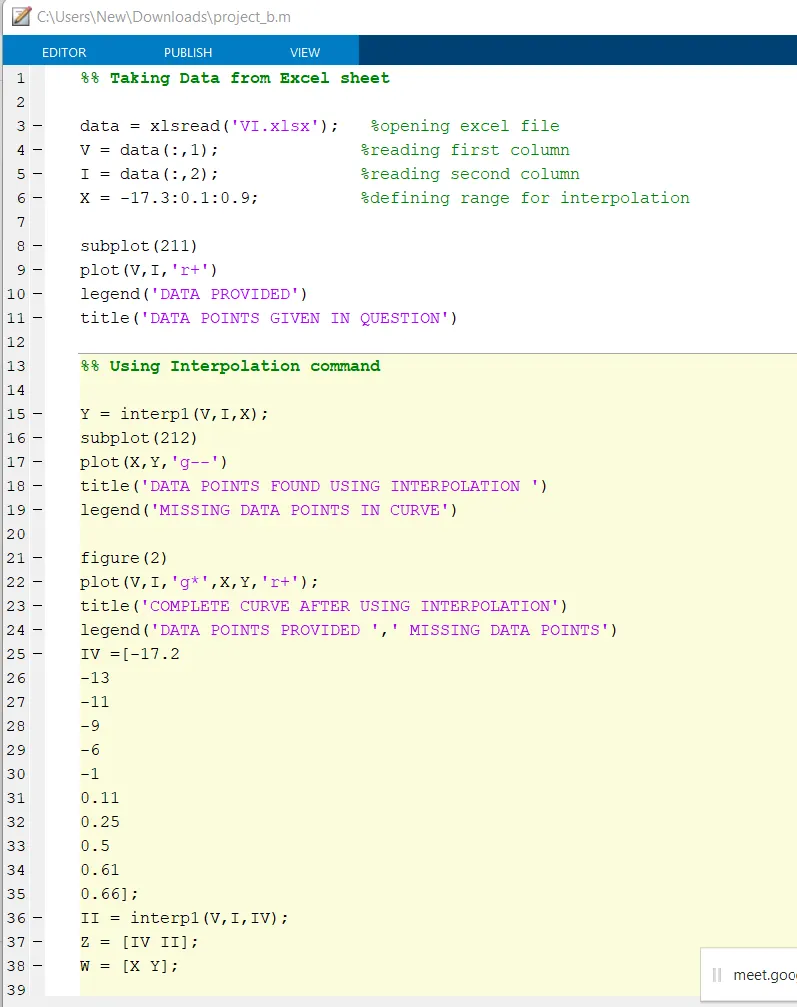
%% Taking Data from Excel sheet
data = xlsread('VI.xlsx'); %opening excel file
V = data(:,1); %reading first column
I = data(:,2); %reading second column
X = -17.3:0.1:0.9; %defining range for interpolation
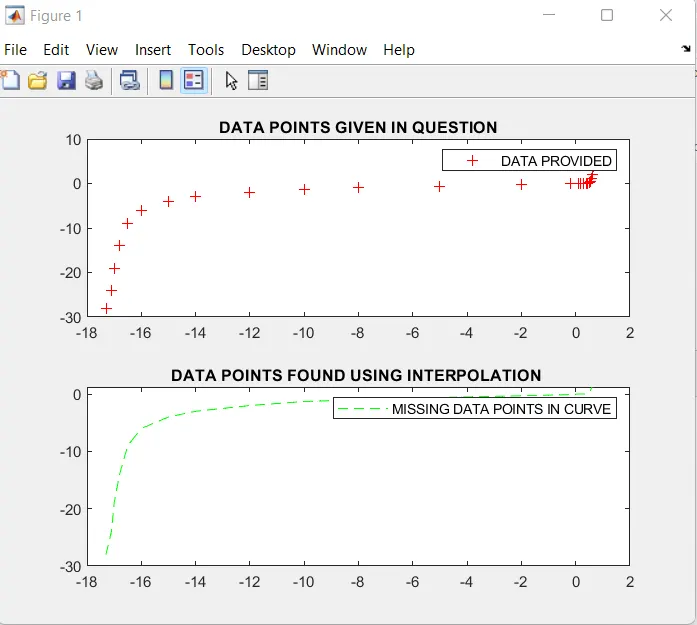
subplot(211)
plot(V,I,'r+')
legend('DATA PROVIDED')
title('DATA POINTS GIVEN IN QUESTION')
%% Using Interpolation command
Y = interp1(V,I,X);
subplot(212)
plot(X,Y,'g--')
title('DATA POINTS FOUND USING INTERPOLATION ')
legend('MISSING DATA POINTS IN CURVE')
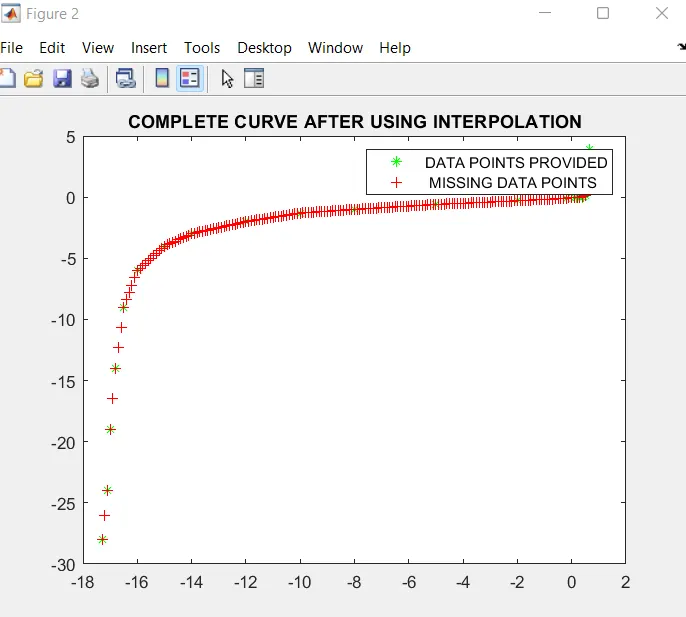
figure(2)
plot(V,I,'g*',X,Y,'r+');
title('COMPLETE CURVE AFTER USING INTERPOLATION')
legend('DATA POINTS PROVIDED ',' MISSING DATA POINTS')
IV =[-17.2
-13
-11
-9
-6
-1
0.11
0.25
0.5
0.61
0.66];
II = interp1(V,I,IV);
Z = [IV II];
W = [X Y];
%% Saving Text File
fileID = fopen('rrr.txt','w'); %saving file text file
fprintf(fileID,'%8s %10s\n','IV','II');
fprintf(fileID,'%f %f\n',Z);
fclose(fileID);
%% Saving Text File
fileID = fopen('ppp.txt','w'); %saving file text file
fprintf(fileID,'%8s %10s\n','X','Y');
fprintf(fileID,'%f %f\n',W);
fclose(fileID);