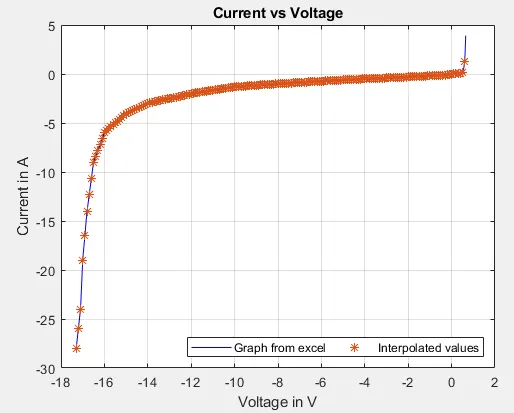
excel_interpol = xlsread('VI.xlsx');%forming an excel sheet in matlab using the excel sheet given in question
voltage = xlsread('VI.xlsx','A:A');% separating the columns of excel sheet
current = xlsread('VI.xlsx','B:B');% separating the columns of excel sheet
hold off;
volt_range = -17.3:0.1:0.9;% As per question
interpol_current = interp1(voltage,current,volt_range);% As per the voltage range, interpolated current value will be returned
writematrix(interpol_current,'interpolated current.txt','Delimiter','tab');%Writes the interpolated current value to file interpolated current.txt
figure(1);
plot(voltage,current,'b-',volt_range,interpol_current,'*');%plots the graph & interpolated values
grid;hold;
legend({'Graph from excel','Interpolated values'},'Location','southeast','Orientation','horizontal')
xlabel('Voltage in V');
ylabel('Current in A');
title('Current vs Voltage');
VV =[-17.2  -17.1  -13.8  -13.5  -13.0  -12.5  -11   -9   -5.76   -6   -1    0.11    0.25   0.5    0.61]; % As given in question
interpol_current1 = interp1(voltage,current,VV); %As per the voltage range, interpolated current value will be returned
writematrix(interpol_current1,'currentforgivenvoltage.txt','Delimiter','tab');%Writes the interpolated current value to file interpolated current.txt