Project - Data Handling and Interpolation
- In the mathematical field of numerical analysis, interpolation is a type of estimation, a method of constructing (finding) new data points based on the range of a discrete set of known data points.
- In engineering and science, one often has a number of data points, obtained by sampling or experimentation, which represent the values of a function for a limited number of values of the independent variable. It is often required to interpolate; that is, estimate the value of that function for an intermediate value of the independent variable.
- Interpolation provides a means of estimating the function at intermediate points, such as {\displaystyle x=2.5.}

- We describe some methods of interpolation, differing in such properties as accuracy, cost, number of data points needed, and smoothness of the resulting interpolant function.
Linear interpolation between two known points
Linear interpolation on a set of data points (x0, y0), (x1, y1), ..., (xn, yn) is defined as the concatenation of linear interpolants between each pair of data points. This results in a continuous curve, with a discontinuous derivative (in general), thus of differentiability class. {\displaystyle C^{0}} .
.
- The key functions to help with interpolation are : interp1 and interp2.
- In engineering applications, we run into situations where some s-y data might not be available.
- In those situations, one can use interpolation to determine the 'y' values corresponding to specific set of 'x' values.
- The interpolation options include : linear , Cubic and spline among the others.
- The original wave can be reproduced with true resemblance using the spline interpolation method.
The output obtained as a 2d plot is as shown below:
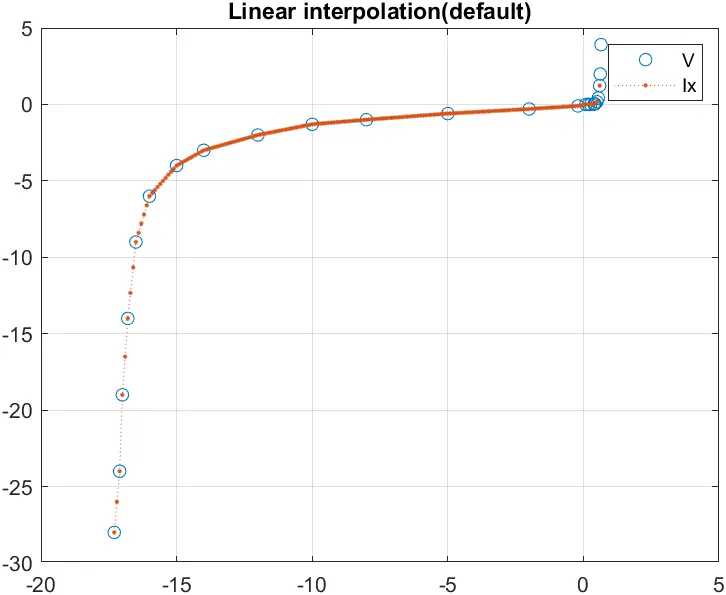
So here the blue rounded points are the interpolated points. range is from -20 to 5. The graph starts exactly at -17.3 and ends at 0.9 as specified in the V range in the question. Since the values are not periodic in nature, the spline interpolation method cannot be used here. Hence a normal linear interpolation is used. The validity of the output graph can be declared by comparing how much the blur points resemble the original dotted line. The corresponding script for the above graph is as follows:
[meta_data]=xlsread('Mat_basics_project_VI.xlsx');%assign the variable to extract data into matrix using xlsxread command
V=meta_data(:,1);%first column is voltage
I=meta_data(:,2);%second column is current
Vx=-17.3:0.1:0.9;%specify the given range of the voltage
Ix=interp1(V,I,Vx);%now using interp1 command find the values of Ix
figure(1);
interpolation=plot(V,I,'o',Vx,Ix,':.');%plot is always two known quantities with unknown values of some points
grid
title('Linear_interpolation');%specify the title
legend('V','Ix');
Z=[Vx' Ix'];
writematrix(Z,'Mat_basic_project.txt' );%save the output in a text file
Here the different function is used instead of saveas function. It is the 'writematrix' function.
writematrix(A) writes homogeneous array A to a comma delimited text file. The file name is the workspace variable name of the array, appended with the extension .txt. If writematrix cannot construct the file name from the array name, then it writes to the file matrix.txt.
Each column of each variable in A becomes a column in the output file. The writematrix function overwrites any existing file.
example
writematrix(A,filename) writes to a file with the name and extension specified by filename.
writematrix determines the file format based on the specified extension. The extension must be one of the following:
.txt, .dat, or .csv for delimited text files
.xls, .xlsm, or .xlsx for Excel® spreadsheet files
.xlsb for Excel spreadsheet files supported on systems with Excel for Windows®
All the lines are explained in the comments accordingly. The output is stored as a text file as follows:
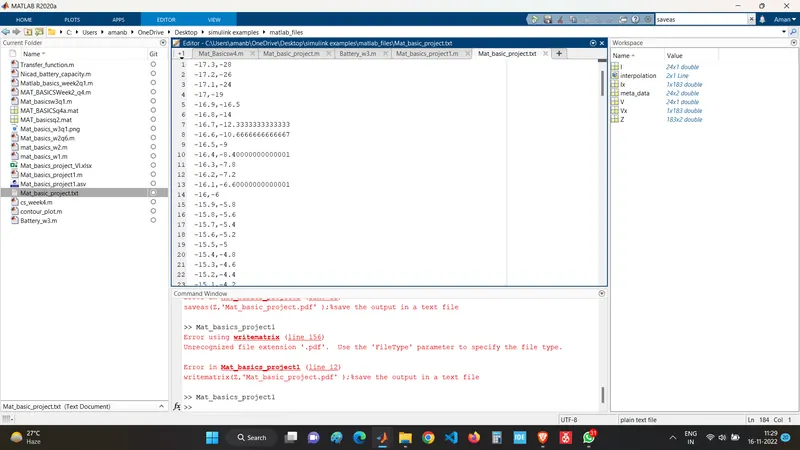
At the end of the file the current values for some corresponding voltages is shown as 'NaN' because the current is not available at that particular instants of time.
Hence the following objectives are completed successfully:
- Find missing data and save it in text
- Interpolate the data set
- Save your program and attach the same.
- Save txt file and upload in attachment
Hence the successful interpolation is performed on the given data set.