Project - Data Handling and Interpolation
Data Handling and Interpolation
As per experiment, data of voltage and current is obtained from excel file VI.xlsx. These values is read in MATLAB program as below.
Part 1 in specified range -17.3:0.1:0.9
v = xlsread('vi.xlsx');
x = v(:,1)
y = v(:,2)
xv = -17.3:0.1:0.9;
as1 = interp1(x,y,xv);
plot (x,y,'*',xv,as1,':.')
xlabel('V(Volt)')
ylabel('I(mAmp)')
grid on
title('Plot of interpolated data (Voltage vs Current)')
gtext('Interpolated data of voltage and current in range -17.3:0.1:0.9','color','green')
aa = fopen('data_handling_1.txt','w')
fprintf(aa,'%f %f \n',VV,as1)
fclose(aa)
Comments
% The excel file having data can be read to Matlab program by using command 'xlsread' as shown above, denoted by variable 'v'.
% Adding values of voltage (V) to variable 'x' and current (I) to variable 'y'.
% These values of V and I are interpolated between range -17.3 to 0.9 having 0.1 intervals as defined by variable 'xv'.
% To carry out the interpolation between x,v, and xv, command called 'interp1' is used stated as variable as1.
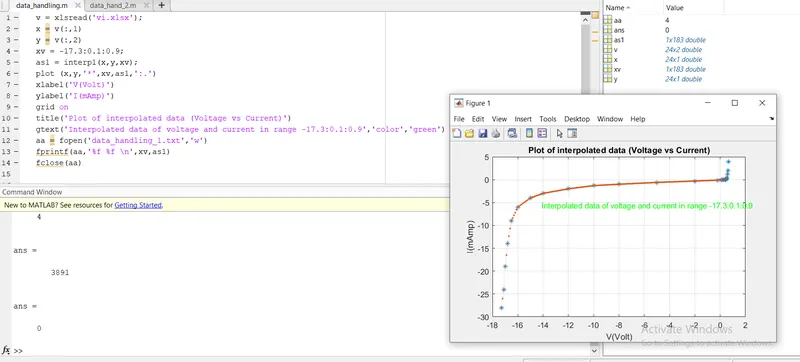
% Plot of the interpolated values is generated as shown in below picture. In plot values of voltage over current is marked by '*'. And the red dots having specific path indicates each and every values of voltage and current ploted in specified renge .
% xlabel and ylabel command is used to indicate voltage in x-axis and current in y-axis.
% For better visualization grids are added to plot with the help of 'grid on' command.
% Specific title is given to plot by using 'title' command
% The 'gtext' command displays required texts to required position in the plot as shown in green words in picture below.
Justification
By running the above program will display results as variable x containing values of voltage read from excel file and other variable y containing values of current. By interpolating these values over a specified renge, plot is generated showing blue * as V and I values and a red dot path indicating each and every possible values of V and I in specified range.
Part 2 for VV range
v = xlsread('vi.xlsx');
x = v(:,1)
y = v(:,2)
VV = [-17.2 17.1 -13.8 -13.5 -13.0 -12.5 -11 -9 -5.76 -6 -1 0.11 0.25 0.5 0.61]
as1 = interp1(x,y,VV);
plot (x,y,'*',VV,as1,':.')
xlabel('V(Volt)')
ylabel('I(mAmp)')
grid on
title('Plot of interpolated data (Voltage vs Current)')
gtext('Interpolated data of voltage and current in range -17.3:0.1:0.9','color','green')
aa = fopen('data_handling.txt','w')
fprintf(aa,'%f %f \n',VV,as1)
fclose(aa)
Comments
% To perform interpolation and compute the values of current for values of voltage given in VV, the same program as in part 1 can be used just by changing variable 'xv' to 'VV' and entering values of voltage at which current is to be computed in variable 'VV'.
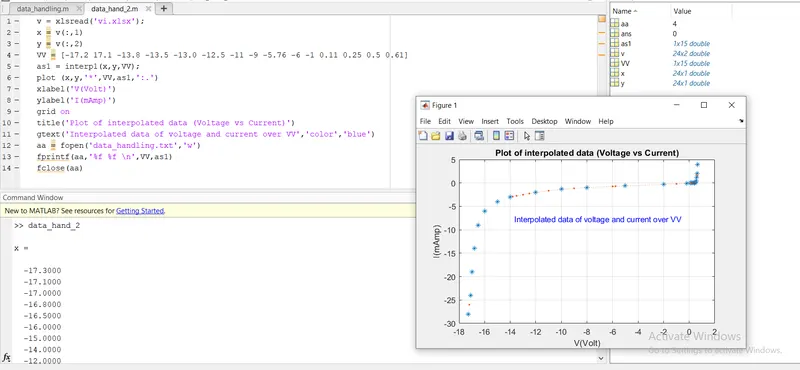
% The plot obtained after replacing values is shown in below picture.
Justification
The values of current is computed and obtained over values of VV as shown in above figure indicated by blue * and red dots denotes values of VV and as1.