Project - Data Handling and Interpolation
1.
data storgare and handling interpolation project.
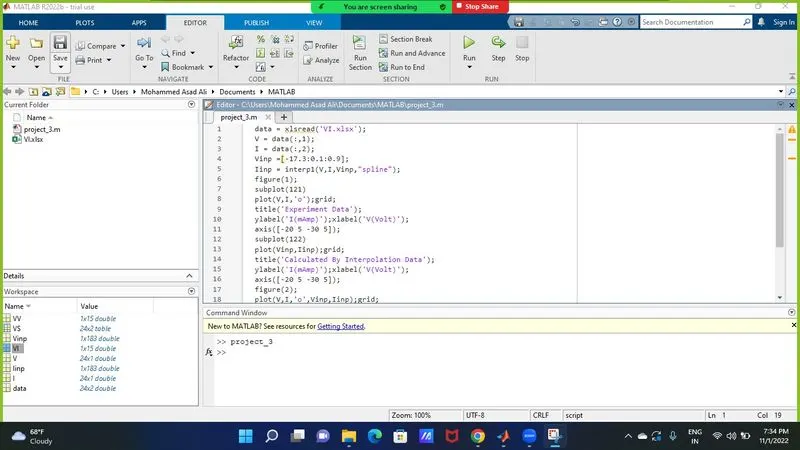
data = xlsread('VI.xlsx');
V = data(:,1);
I = data(:,2);
Vinp =[-17.3:0.1:0.9];
Iinp = interp1(V,I,Vinp,"spline");
figure(1);
subplot(121)
plot(V,I,'o');grid;
title('Experiment Data');
ylabel('I(mAmp)');xlabel('V(Volt)');
axis([-20 5 -30 5]);
subplot(122)
plot(Vinp,Iinp);grid;
title('Calculated By Interpolation Data');
ylabel('I(mAmp)');xlabel('V(Volt)');
axis([-20 5 -30 5]);
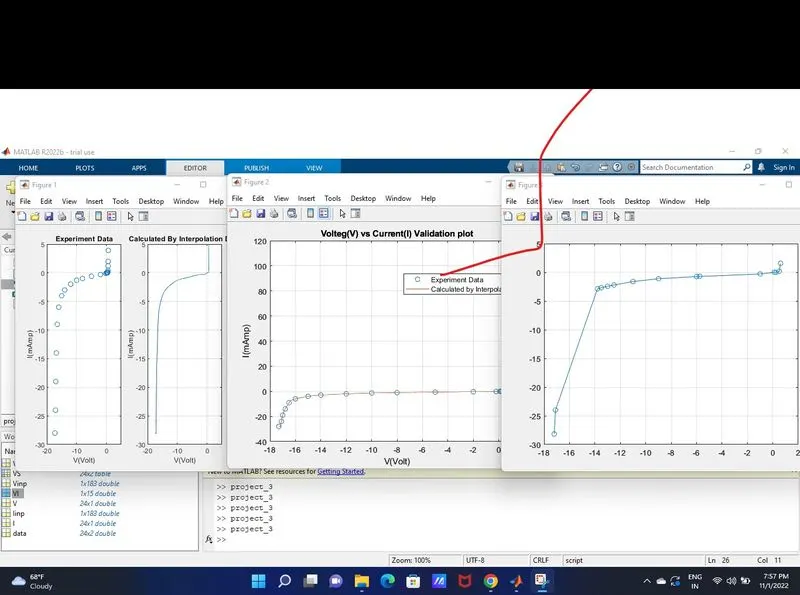
figure(2);
plot(V,I,'o',Vinp,Iinp);grid;
title('Volteg(V) vs Current(I) Validation plot');
xlabel('V(Volt)');ylabel('I(mAmp)');
legend('Experiment Data','Calculated by Interpolation','Location','best');
VV =[-17.2 -17.1 -13.8 -13.5 -13.0 -12.5 -11 -9 -5.76 -6 -1 0.11 0.25 0.5 0.61];
VI = interp1(V,I,VV,"spline");
figure(3);
plot(VV,VI,'-o');grid;
save x.txt