Project - Data Handling and Interpolation
Project :
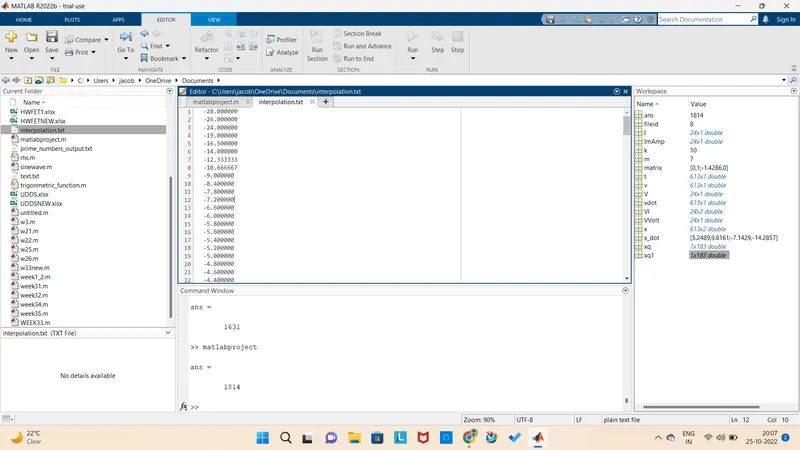
In a laboratory experiment, data of voltage and current has been recorded and the same is attached in an excel file ( Click on this link VI.xlsx ). Read the excel file in the Matlab program and perform the interpolation in the range of -17.3:0.1:0.9. Generate the interactive plot for the interpolated data and store them in a text file.
Key Highlights:
- Graphical solutions are more visual and appealing
- Interpolation of data
- Read excel file
- Write to text file
Deliverables:
- Find missing data and save it in text
- Interpolate the data set
- Save your program and attach the same.
- Save txt file and upload in attachment
Ans :
Aim :
To Generate the interactive plot for the interpolated data and store them in a text file.
Matlab code :
Here am attaching the code for interpolation . I have used interp1 command for interpolation and xq1 is output for it.
%% code for interpolation of given data
VI1 = xlsread('VI.xlsx'); % taking VI data from excel
ImAmp = VI(:,2); % defining ImAmp
VVolt = VI(:,1); % defining VVolt
I = ImAmp; % defining a variable I from excel file
V = VVolt; % defining a variable V from excel file
xq = [-17.3:0.1:0.9]; % defining the range for interpolation
xq1 = interp1(V,I,xq); % interpolation
figure(1);
plot(I,V,'o',xq,xq1,':'); % plotting the interpolation
xlabel('current I');
ylabel('volts V');
title('current and Voltage');
legend('current','voltage')
grid;
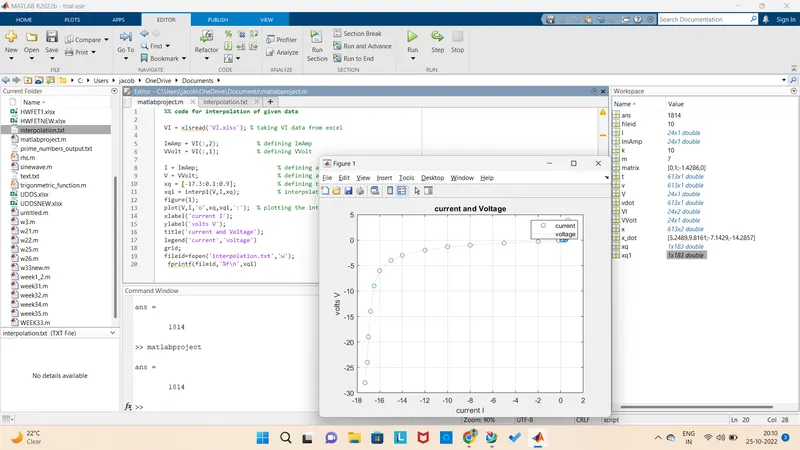
plot :
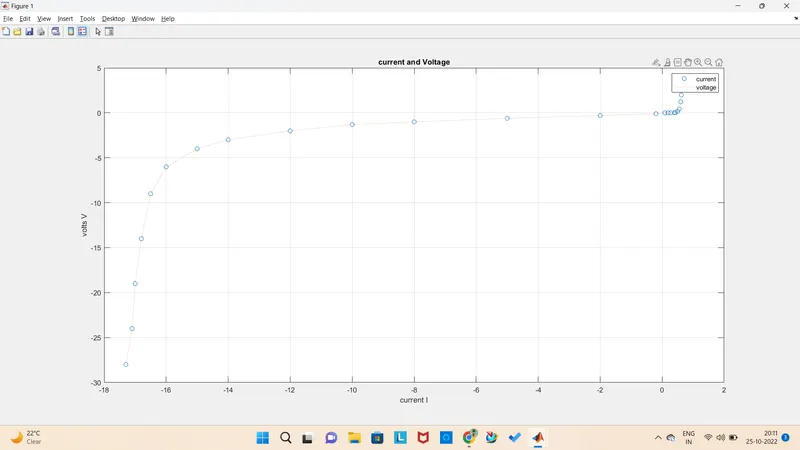
given data
| Vvolt | ImAmp |
| -17.3 | -28 |
| -17.1 | -24 |
| -17 | -19 |
| -16.8 | -14 |
| -16.5 | -9 |
| -16 | -6 |
| -15 | -4 |
| -14 | -3 |
| -12 | -2 |
| -10 | -1.3 |
| -8 | -1 |
| -5 | -0.6 |
| -2 | -0.3 |
| -0.2 | -0.1 |
| 0.09 | 0 |
| 0.19 | 0 |
| 0.27 | 0 |
| 0.39 | 0.01 |
| 0.43 | 0.03 |
| 0.5 | 0.17 |
| 0.55 | 0.42 |
| 0.6 | 1.23 |
| 0.62 | 1.99 |
| 0.65 | 3.91 |
fileid=fopen('interpolation.txt','w');
fprintf(fileid,'%f\n',xq1)