Project - Data Handling and Interpolation
% This project reads data from an excel sheet and do an interpolation of the
% required range of data
V=xlsread('C:\Users\J\Desktop\challenge 3 session,msges\last project\VI (1) data file interpolation project voltage vs current.xls',1,'A2:A25');
% Reading the values of voltage and storing them into vector V.
I=xlsread('C:\Users\J\Desktop\challenge 3 session,msges\last project\VI (1) data file interpolation project voltage vs current.xls',1,'B2:B25');
% Reading the values of current and storing them into vector I.
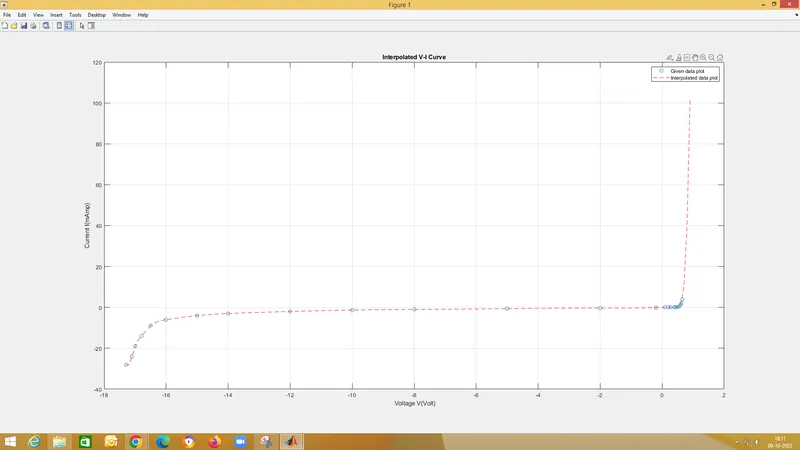
plot(V,I,'o'); % plotting V Vs I plot
hold on; % holding plot for overlapping
Vh=[-17.3:0.1:0.9]; % Range of interpolation.
Ih=spline(V,I,Vh);
plot(Vh,Ih,'r--'); % plotting interpolated Vh Vs Ih curve.
grid; %setting up the grid
xlabel(' Voltage V(Volt)');%labelling the plot
ylabel('Current I(mAmp)');
title('Interpolated V-I Curve');
legend('Given data plot','Interpolated data plot');
F=[Vh;Ih];
name='values of interpolated data'; % title of text file
Vh='Voltage(Volt)'; %labeling the coloumns of text file
Ih='Current(mAmp)';
fid = fopen('interpolateproject_prabhu_quest.txt','w'); %creating text file
fprintf(fid,'%s\n\n',name);
fprintf(fid,'%s %s\n',Vh,Ih);
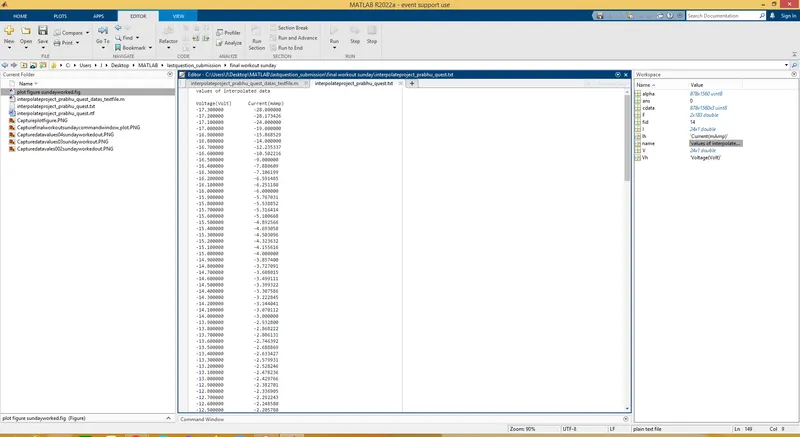
fprintf(fid,'%f %f\n',F);
fclose(fid);
---------------------------------
output plot:
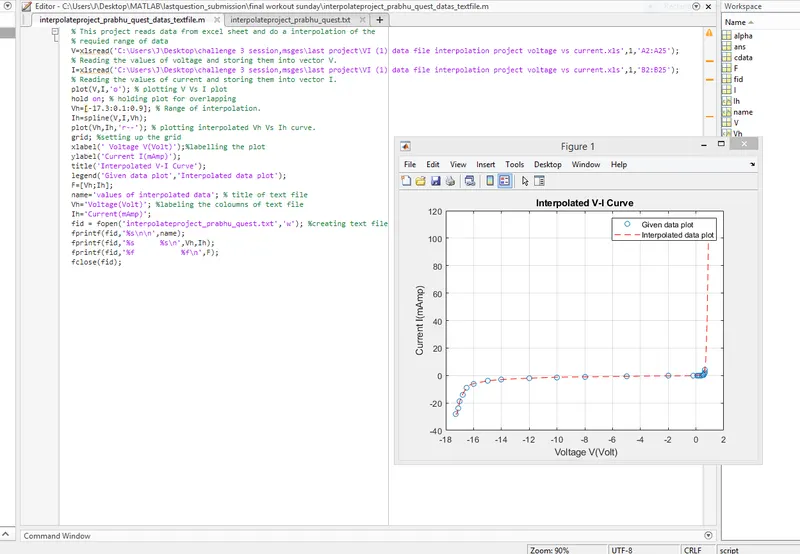
screenshot command window,plot:
data file saved text format :
file 1:
file2:
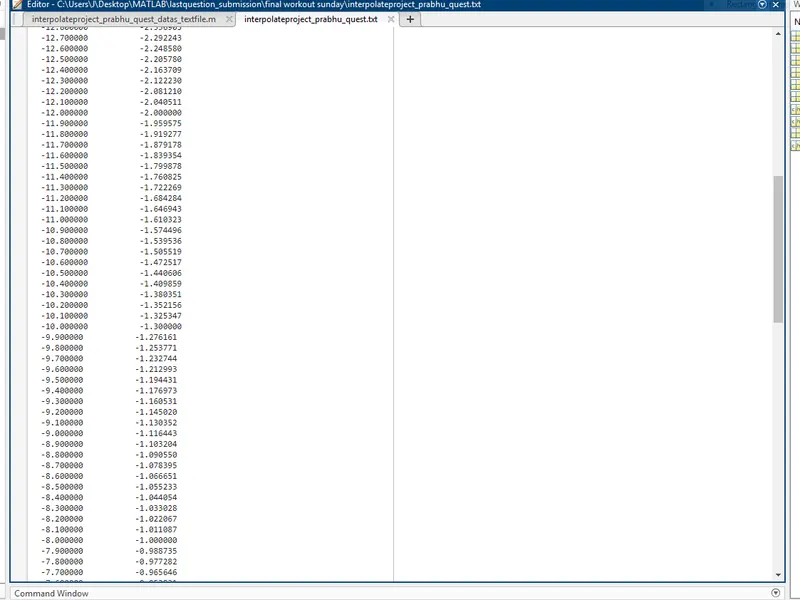
file3:
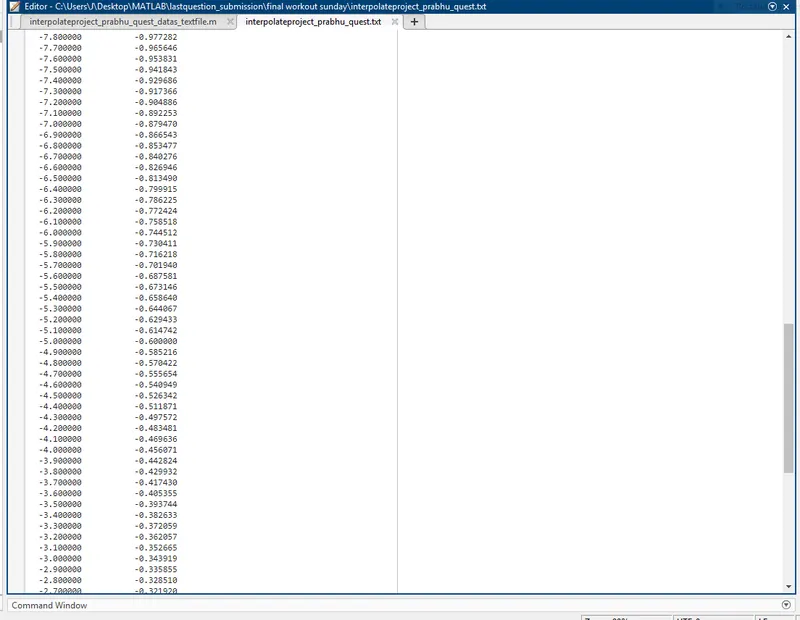
file4:
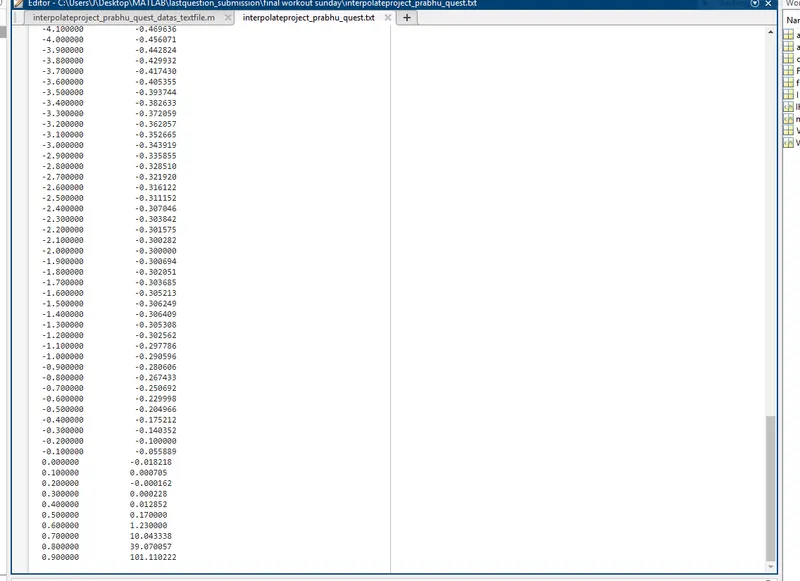
----------------------------------------