Project - Data Handling and Interpolation
Handling and interpolating the Data Objective: read the laboratory experimented data from the excel file extract the data and store it in variables. Then interpolate them. Compute the current from the given voltage data.Store this computed data in the text file .
AIM:
Handling and interpolating the Data
Objective:
read the laboratory experimented data from the excel file.
extract the data and store it in variables.
Then interpolate them.
Compute the current from the given voltage data.
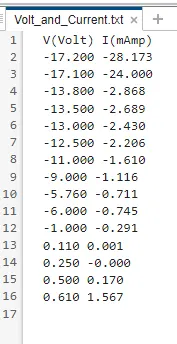
Store this computed data in the text file .
f = xlsread('VI.xlsx');%Reading the xlsx file
V = f(:,1);%storing first column value of 'f' in 'V'
I = f(:,2);%storing second column value of 'f' in 'A'
Vinp = -17.3:0.1:0.9;% Creating Given Range of Voltage Data mentioned in problem
Iinp = interp1(V,I,Vinp,"spline");% Using 'interp1' function for calculating Current value for given %Voltage Range 'Vinp'
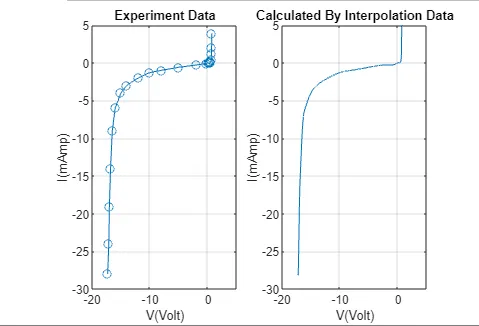
figure(1);
subplot(121)
plot(V,I,'-o');grid;% Ploting trig_function with time
title('Experiment Data');%giving title for the figure
ylabel('I(mAmp)');xlabel('V(Volt)');%giving lables to both the axis
axis([-20 5 -30 5]);%Defining axis limits
subplot(122)
plot(Vinp,Iinp);grid;% Ploting trig_function with time
title('Calculated By Interpolation Data');%giving title for the figure
ylabel('I(mAmp)');xlabel('V(Volt)');%giving lables to both the axis
axis([-20 5 -30 5]);%Defining axis limits
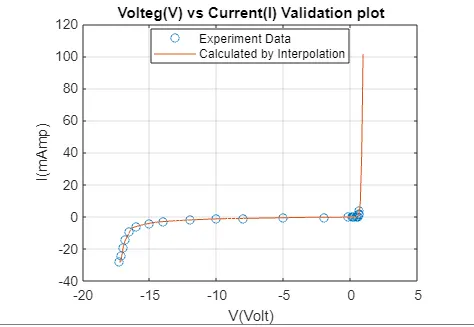
figure(2);
plot(V,I,'o',Vinp,Iinp);grid;%ploting the values
title('Volteg(V) vs Current(I) Validation plot');%giving title for the figure
xlabel('V(Volt)');ylabel('I(mAmp)');%labeling X and Y axis
legend('Experiment Data','Calculated by Interpolation','Location','best');% Showing legends
VV =[-17.2 -17.1 -13.8 -13.5 -13.0 -12.5 -11 -9 -5.76 -6 -1 0.11 0.25 0.5 0.61];% Given Voltage Data IN %problem
VI = interp1(V,I,VV,"spline");% Using 'interp1' function for calculating Current value for given Voltage
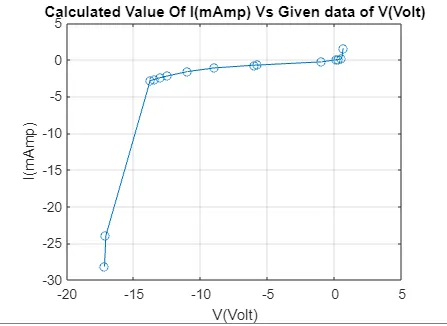
figure(3);
plot(VV,VI,'-o');grid;%ploting the values
title('Calculated Value Of I(mAmp) Vs Given data of V(Volt)');%giving title for the figure
xlabel('V(Volt)');ylabel('I(mAmp)');%labeling X and Y axis
fid = fopen('Volt_and_Current.txt','w');% opening output file
fprintf(fid,'V(Volt) I(mAmp)\n');% storing value of variable x in file
for i = 1:length(VV)
fprintf(fid,'%.3f %.3f\n',VV(i),VI(i));% storing value of variable x in file
end
fclose(fid);% closing output file
Result :
Result for Additional Data :
Calculated and ploted