Project 2
1)Task:
1) Load the Project2 folder as the Current Folder in Matlab.
2) Run the “Project2_InitFile.m” Matlab script.
3) Copy the Conventional vehicle Simulink model created for Project 1 in this folder. Figure 1: P1 Hybrid ArchitectureHybrid Drives Development
4) Modify this model into a hybrid vehicle model. The lecture presentations can be used as reference. Battery and Supervisory controller models developed in the assignments can be reused.
5) Add additional ‘To Workspace’ blocks for transferring the desired Simulink vehicle data into the Matlab workspace.
6) Simulate the hybrid model on the desired drive cycles.
7) Write a project report that contains the following:
a. Tabulate the fuel economy numbers (kmpl) for UDDS and HWFET cycle. Compare these numbers with the baseline numbers for conventional vehicle model from Project 1.
b. Plot the time trace for engine, transmission input, transmission output and wheel speed on one plot.
c. Plot engine torque, engine power, fuel rate and fuel consumption using subplots.
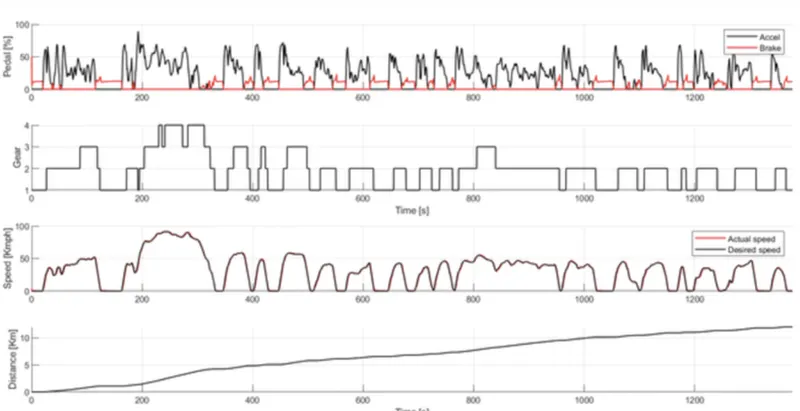
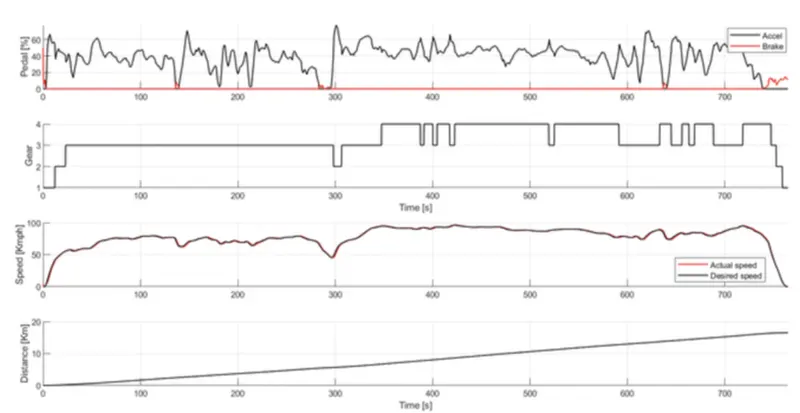
d. Plot accelerator and brake pedal, gear command, vehicle desired and actual speed, vehicle distance using subplots.
e. Plot the engine operating points on the engine fuel map.
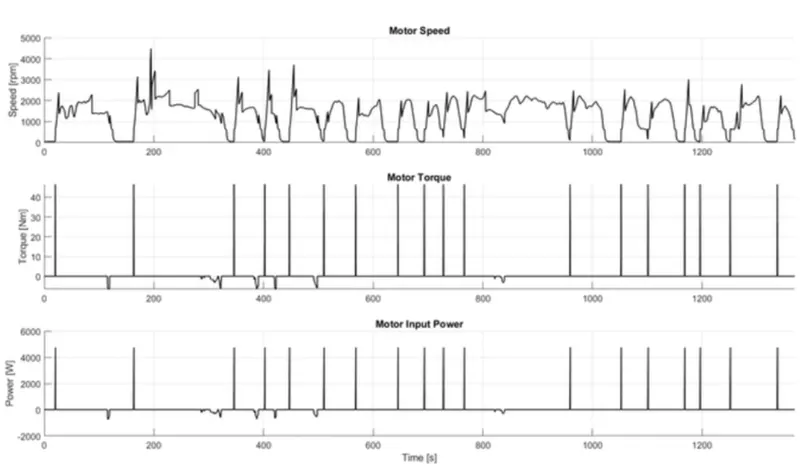
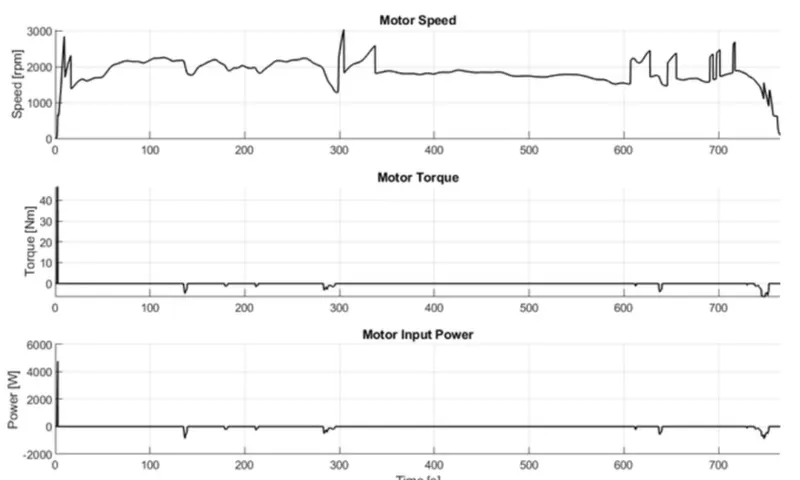
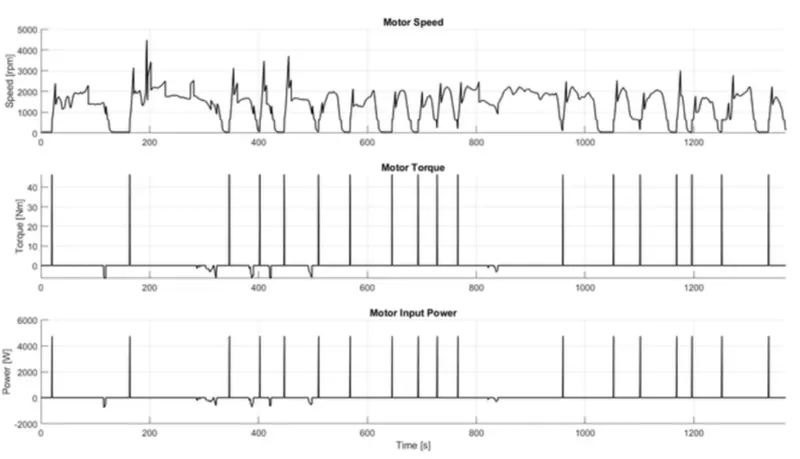
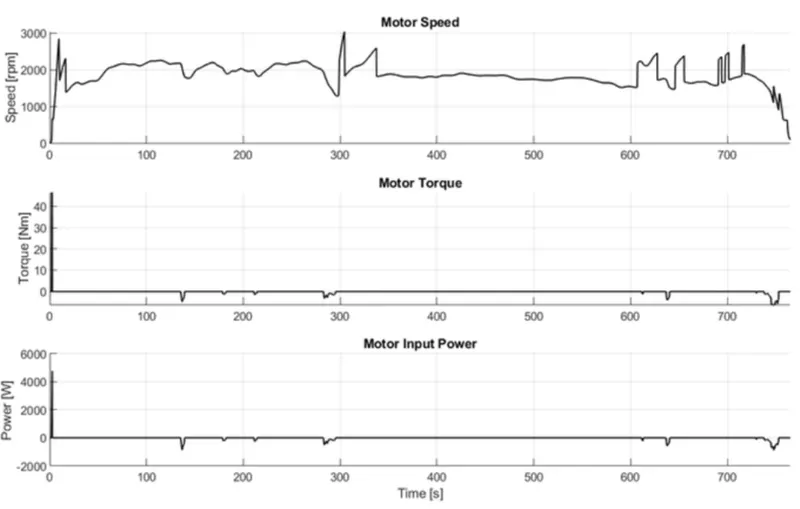
f. Plot motor speed, torque, motor input power using subplots.
g. Plot pack voltage, current and SoC using subplots.
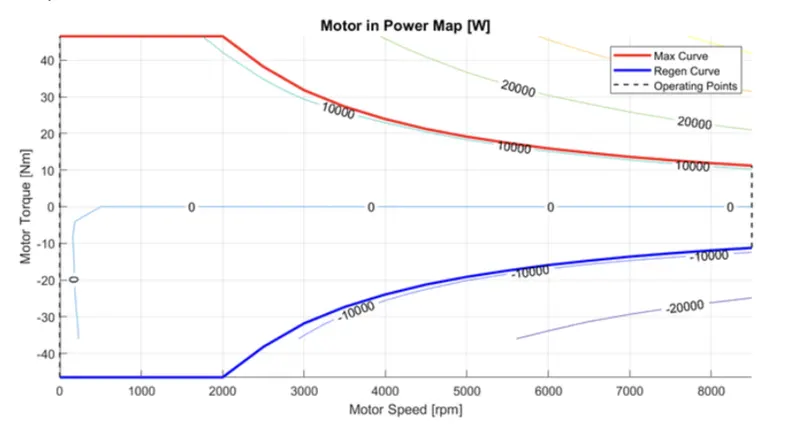
h. Plot the motor operating points on the motor input power map, with the motor max motoring and generating torque curves.
i. Write down appropriate brief comments on each of these plots, describing the vehicle behavior throughout the drive cycle.
j. Generate the plots for both drive cycles
Theory :
Forward modelling approach :
- The forward model is a computational model of voluntary motor control that emphasizes the critical role of the comparison between the intentional content of our actions and their outcomes.
- This approach is based on vehicle dynamics equations and the behaviour of each powertrain components and their dynamic interaction.
- It is is also known as cause-effect, engine-to-wheel or rear-to-front method.
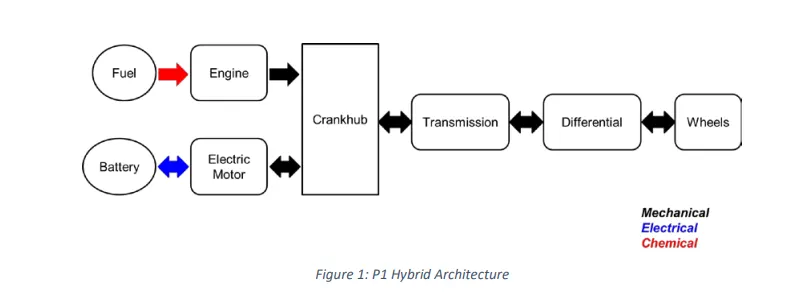
Honda Insight motor and battery are considered for this project. Data is taken from ADVISOR data base developed by NREL, USA. Data provided in the project file.

VEHICLE MODEL :
Pre-Processing
%%%%%%%%%%%%%%%%%%%%%%%%%%%%%%%%%%%%%%%%%%%%%%%%%%%%%%%%%%%%%%%%%%%%%
- The Drive Cycle can be selected from this MATLAB Script, By changing the variable Drive _Cycle _Select to,
- UDDS
- HWFET
Simulink Modeling :
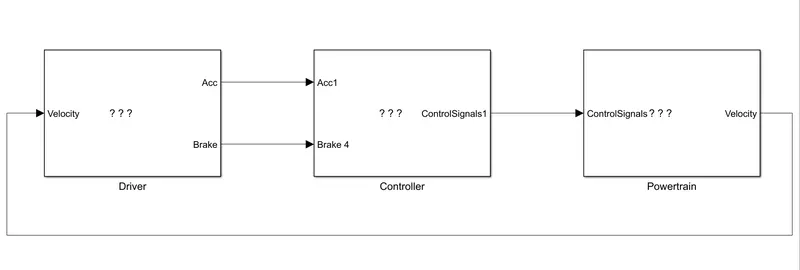
- The Hybrid vehicle architecture consists of a driver block,a controller block and a power train.
- The speed of the vehicle is sent to the driver block as feedback and controller analysis it and contols the speed,torque of the motor accordingly.
- Then the command is sent to the power train and the vehicle responds as commanded.
Driver Model :
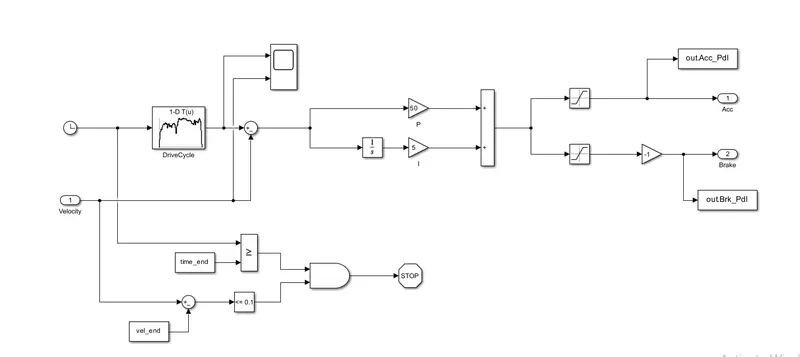
- The driver model is based on the PI controller in which the feedback is taken and analysed.
- Here the PI controller compares the required drive cylcle and the actual vehicle speed and gives command to the powertrain and the powertrain functions accordingly.
Controller Model :
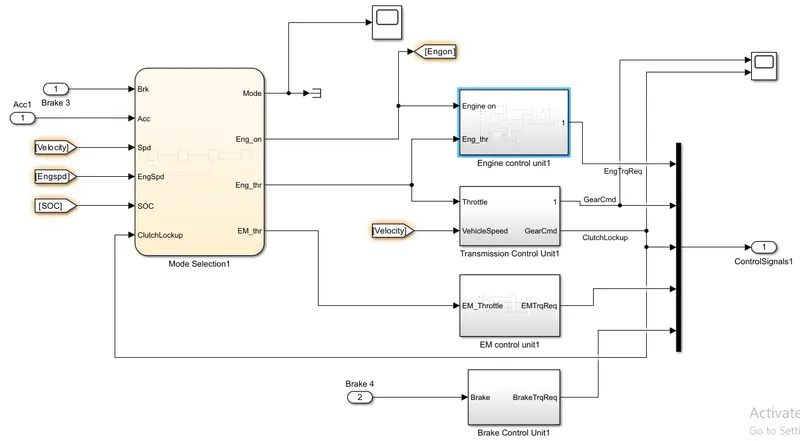
- The controller unit is the brain of the vehicle.
- It controls the motor torque,speed, and the desired transmission gear and broke.
- The mode selection is done using the chart block and desired input cases is fed.
- This controller model also has some subsystems like engine control unit,Transmission control unit,EM control unit and a brake control unit.
- All this subsystems will be explained shortly.
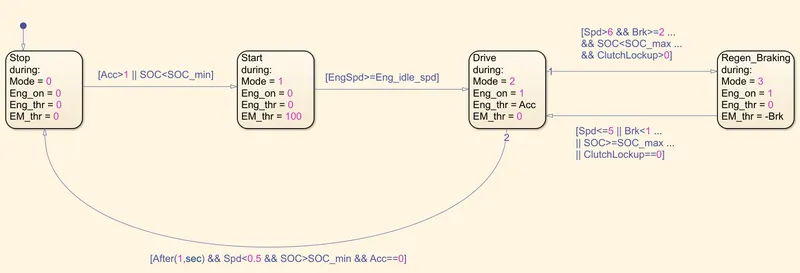
- In the above chart the various input are given like during the start the engine should be on and the throtttle should be zero.
- During the start the electric throttle should be 100.
- During the drive the engine should be on and the vehicle should accelerate.
- While regenerative braking the engine should be on and the brakes should be applied.
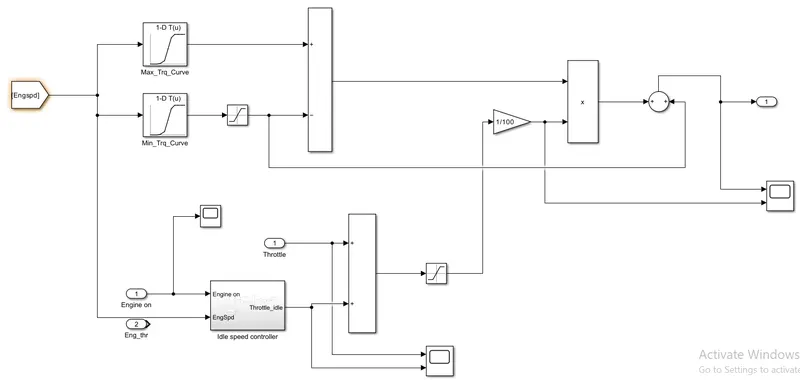
Engine control unit :
Idle speed controller :
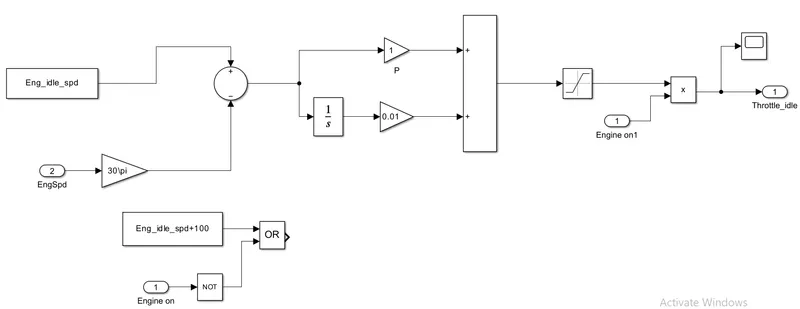
- Engine Control Unit Compare engine speed with the maximum torque and minimum torque curves of the lookup table and give the required torque command to the engine block. The throttle input is combined with the idle speed throttle and gains with the torque output from the lookup table to estimate the torque input required for the engine.
Electric Motor :
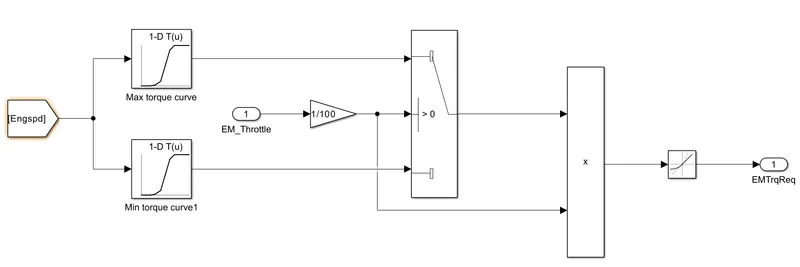
- This controller compares the minimum and maximum torque and gives the required to the motor.
- Here the input is the engine speed.Then two torques are compared using the look up tables.
- The switch block is used here.
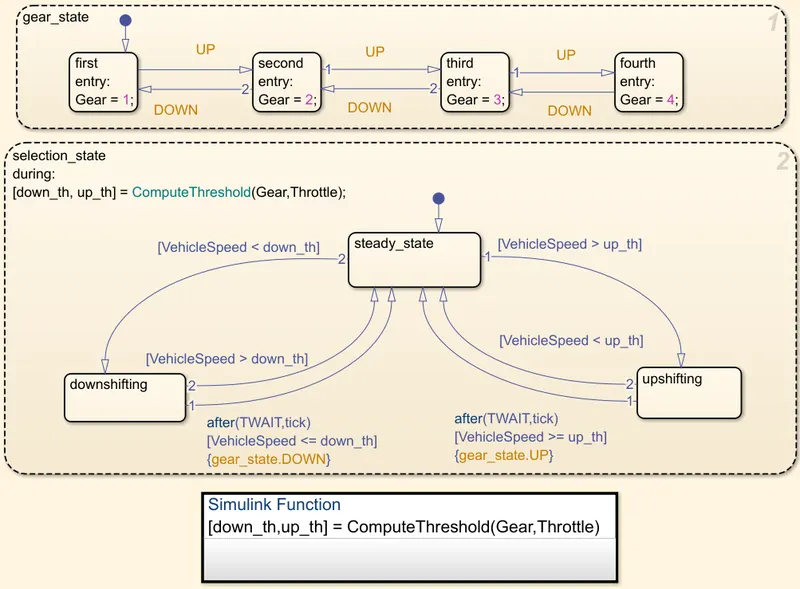
Transmission control block :
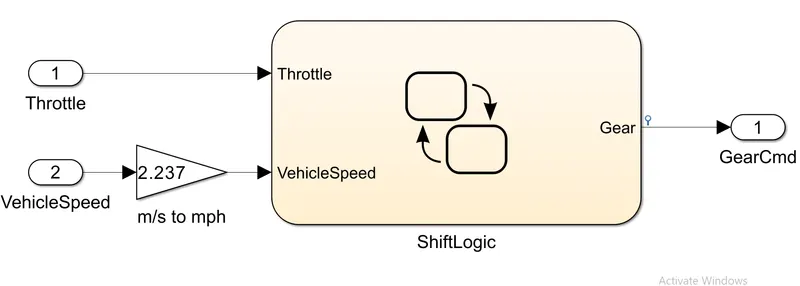
- Transmission control block changes or selects the gear according to the requirements using study flow variable chart.
Brake control unit :
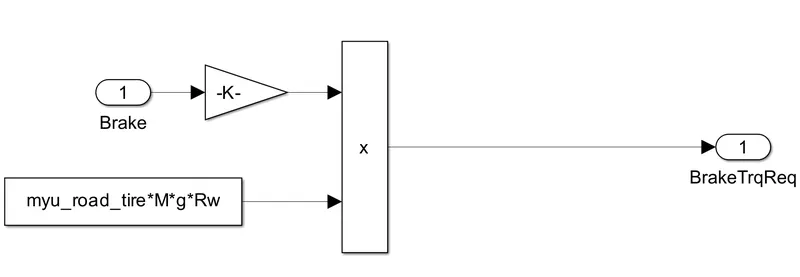
- The brake control unit provides the required brake torque according to the input provided by the driver on the brake pedal and applies the break torque for the wheels.
Power train model for an hybrid vehicle :
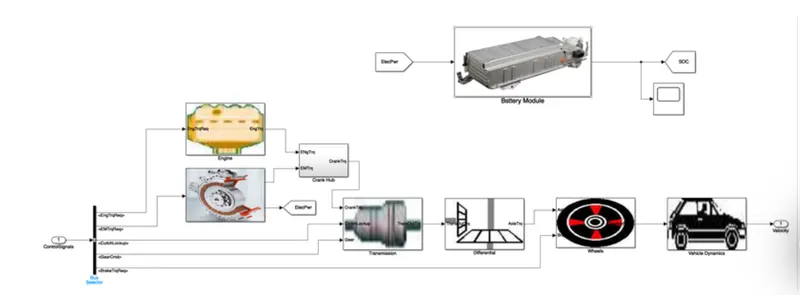
- The above diagram is the power train model for an hybrid vehicle.
- It consists of an engine,electric motor,transmission,battery module,differential,wheel,vehicle dynamics
Battery Module :
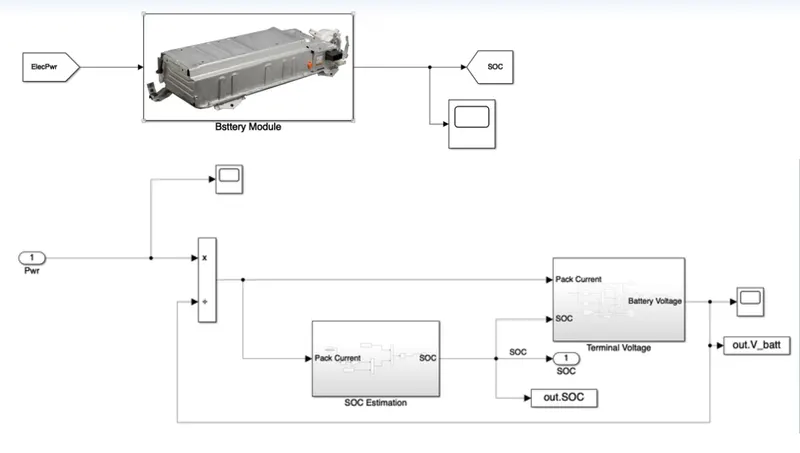
- The above image represents the battery module.
- It consits of SOC estimation,terminal voltage subsystems which will be explained shortly.
- The input is the electric power.
SOC Estimation Model :
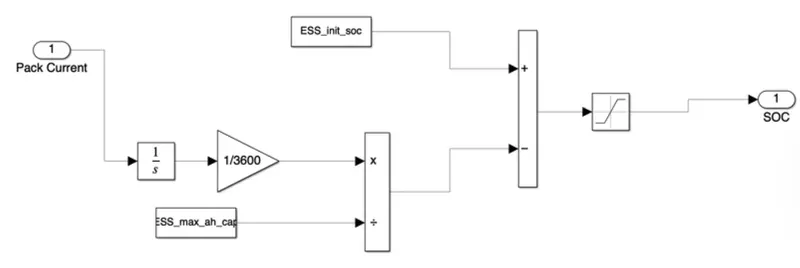
- The battery pack is taken as the input and it is integrated to get the columbs and that value is multiplied with a gain block of 1/3600 to convert into amph hours.
- Then that value is divided with the Battery max amphere to get the used SOC.Then that value obtain through this is subtracted with the battery initial state of charge.
- Then the saturation block is taken to limit the value from 0 to 1.So the final value obtained is the SOC.
Terminal Voltage :
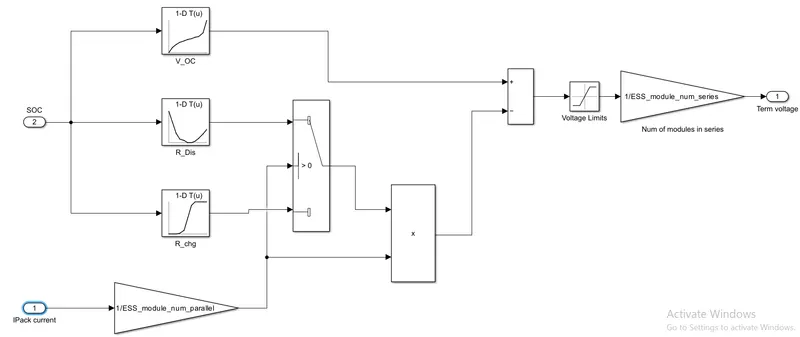
- Here the input is taken as the state of charge.It is linked to 2D look up table and the value of table data and the breakpoints were given according to the battery requirements.
- The charging and discharging look up table is selected using a switch and multiplied with the battery module num paralllel gain block.
- This in turn is subtracted with the V_OC look up table.Then through the saturation block the maximum and minimum voltage is selected.
- Then it was connected to the battery module num series gain block to obtain the term voltage.
Engine Model :
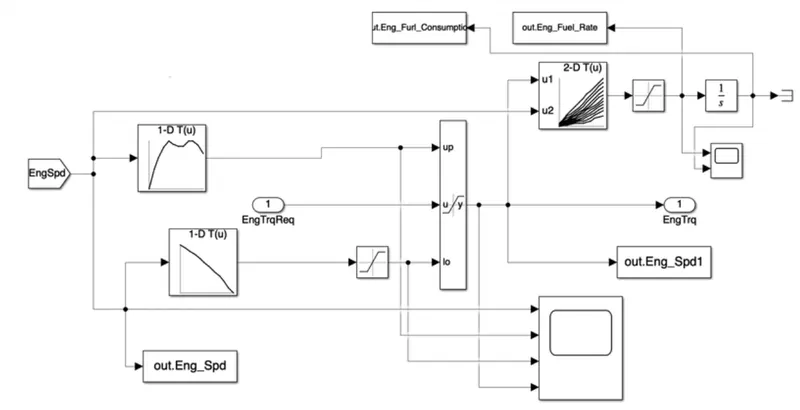
- Based on the Engine speed The required EM torque from the controller is saturated between Max EM torque curve and max EM torque Generation curve and passes the EM torque to the Crank Hub.
- The 2D lookup table is used to calculate the Input Electric Power to the Motor based on EM speed and EM torque.
Crank Hub :
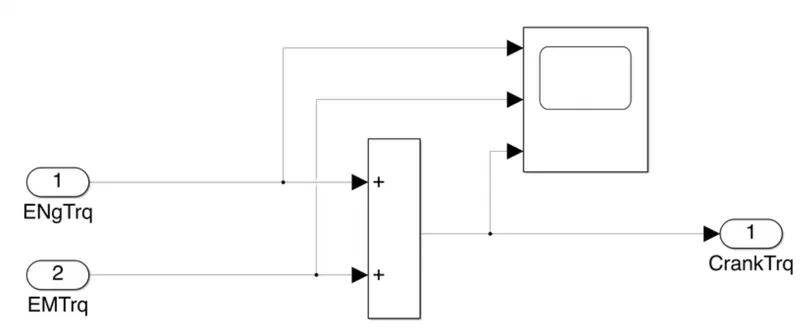
- This one takes the engine torque and EM torque as input and delivers it to the transmission block.
Transmission Module :
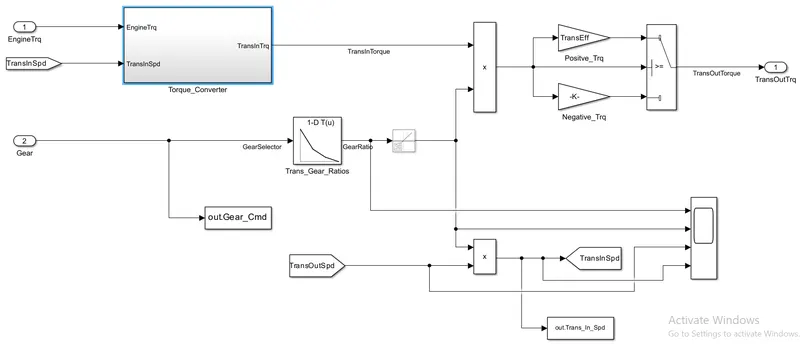
- The input to this module is engine torque and gear.
- Accordingly the gear selection is made and the required vehicle dynamics is applied.
Torque Converter:
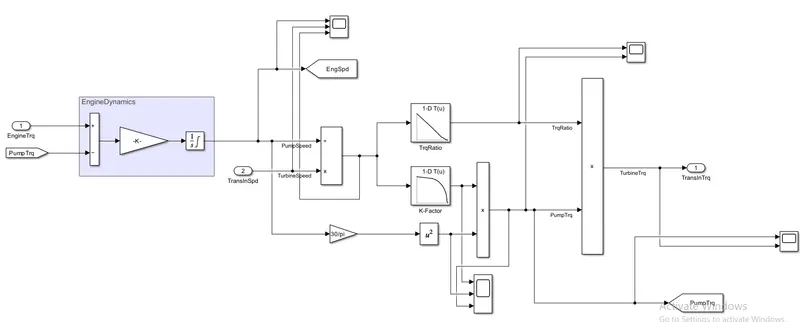
- The torque converter defines the pump and turbine torque by the clutch lock up status and the combination gives us the desired transmission torque.
Differential Model :
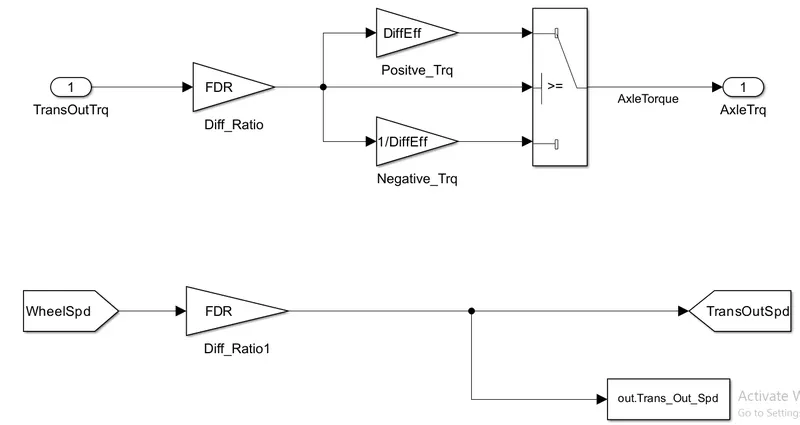
- The transmission output torque is taken and the required torque is transmitted to the wheels as axle torque.
Wheel Model :
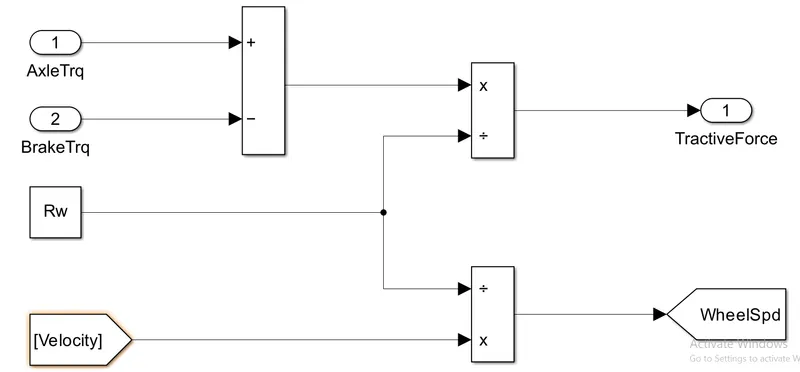
- The above represents the wheel model.
- The velocity is divided with the rolling radius to get the wheel speed.
Vehicle dynamics :
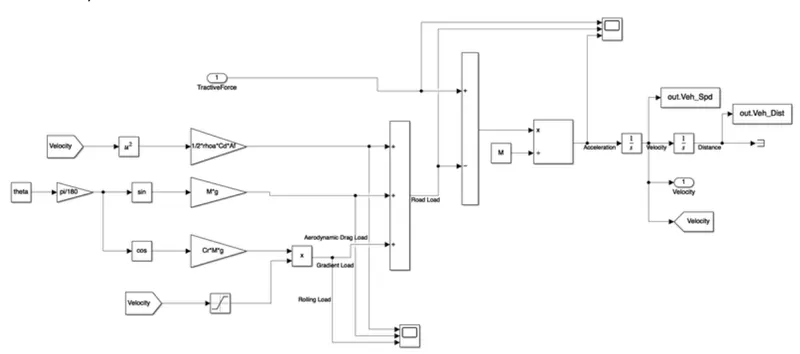
- This is a representation of the vehicle dynamics block.
SIMULATION RESULTS :
Time = out.tout;
Acc_Pdl = out.Acc_Pdl;          % Accelerator pedal [%]
Brk_Pdl = out.Brk_Pdl;          % Brake pedal [%]
Gear_Cmd = out.Gear_Cmd;        % Transmission gear
Trans_In_Spd = out.Trans_In_Spd*30/pi;  % Transmission input speed [rpm]
Trans_Out_Spd = out.Trans_Out_Spd*30/pi;% Transmission output speed [rpm]
Eng_Trq = out.Eng_Trq;          % Engine brake torque [Nm]
Eng_Spd = out.Eng_Spd*30/pi;    % Engine speed [rpm]
Eng_Fuel_Consump = out.Eng_Fuel_Consumption;    % Engine fuel consumption [g]
Veh_Dist = out.Veh_Dist/1000;   % Distance traveled by vehicle [km]
Veh_Spd = out.Veh_Spd*18/5;     % Vehicle speed [kmph]


%% Data Analysis
Eng_Pwr = Eng_Spd*pi/30.*Eng_Trq/1000;   % Engine brake power [kW]
rho_petrol = 0.7197;                    % Density of petrol [kg/L]
kmpl = Veh_Dist(end)/(Eng_Fuel_Consump(end)/1000/rho_petrol);    % Fuel economy [kmpl]


%% Plotting vehicle characteristics time trace
figure()
subplot(3,1,1)
hold on
grid on
plot(Time, Acc_Pdl, 'linewidth', 1, 'Color', 'black');
plot(Time, Brk_Pdl, 'linewidth', 1, 'Color', 'red');
ylabel('Pedal [%]')
xlim([0, Time(end)]);
legend('Accel','Brake');
subplot(3,1,2)
hold on
grid on
plot(Time, Trans_In_Spd, 'linewidth', 1, 'Color', 'black');
plot(Time, Trans_Out_Spd, 'linewidth', 1, 'Color', 'red');
ylabel('Speed [rpm]')
xlim([0, Time(end)]);
ylim([0, 6000]);
legend('Trans Input','Trans Output');
subplot(3,1,3)
hold on
grid on
plot(Time, Gear_Cmd, 'linewidth', 1, 'Color', 'black');
xlim([0, Time(end)]);
xlabel('Time [s]');
ylabel('Gear');

%% Plotting engine operating points on engine fuel map
figure('Name','Engine Operating Points');
hold on
grid on
title('Engine Operating Points','fontsize',12);
p1=plot(Eng_map_spd*30/pi,Eng_max_trq,'linewidth',2,'color','r');
p2=line([Eng_map_spd(end)*30/pi Eng_map_spd(end)*30/pi],[0 Eng_max_trq(end)]);
set(p2,'linewidth',1,'linestyle','--','color','k');
p3=line([Eng_map_spd(1)*30/pi Eng_map_spd(1)*30/pi],[0 Eng_max_trq(1)]);
set(p3,'linewidth',1,'linestyle','--','color','k');
[c,h] = contour(Eng_map_spd'*30/pi,Eng_map_trq,Eng_fuel_map');
clabel(c,h);
xlabel('Engine Speed [rpm]');
ylabel('Engine Torque [Nm]');
title('Engine Fuel Consumption Map [g/s]');
p4 = plot(Eng_Spd,Eng_Trq,'.','color','k');
legend([p1 p4],{'Max Curve','Operating Points'});
axis([Eng_map_spd(1)*30/pi Eng_map_spd(end)*30/pi 0 Eng_map_trq(end)]);
RESULT :
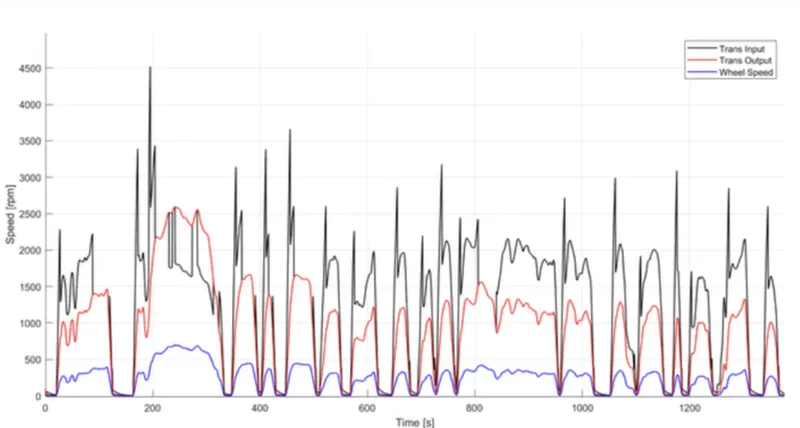
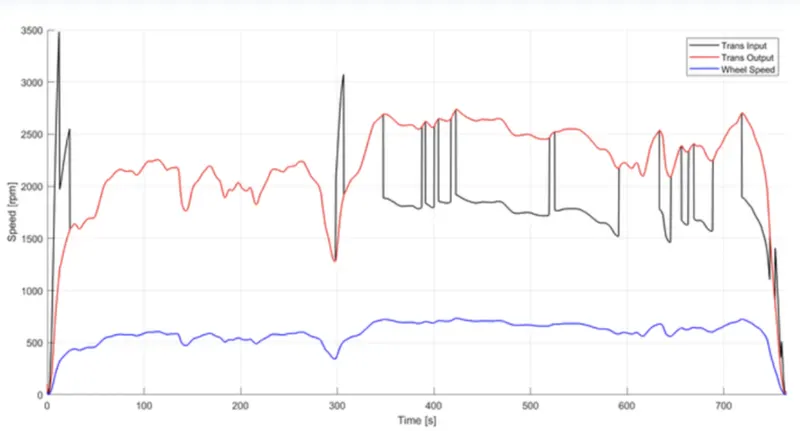
1) The Time trace for engine, Transmission input,transmission output and wheel speed :
UDDS :
 \
\
HWFET :
2) Accelerator and brake pedal, gear command, vehicle desired and actual speed, vehicle distance :
UDDS :
HWFET :
3) The Motor speed, torque, motor input power :
UDDS :
HWFET :
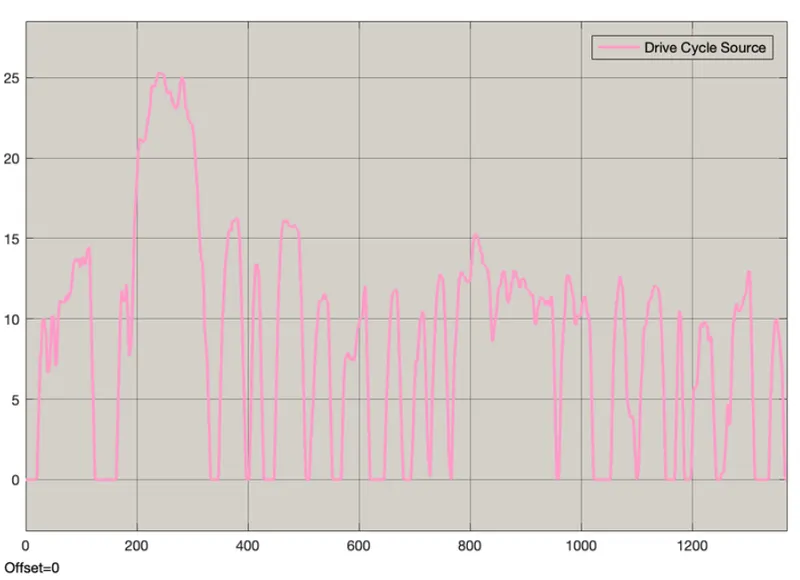
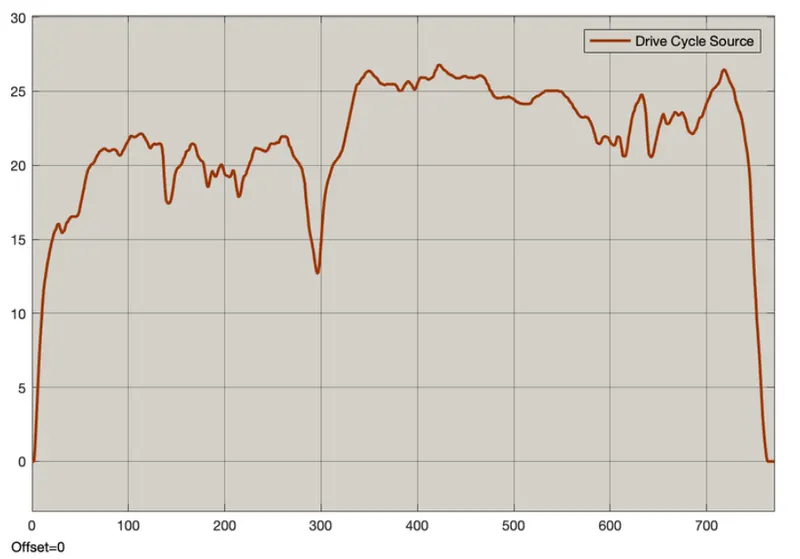
4)Drive Cycle :
UDDS :
HWFET :
5) The motor operating points on the motor input power map, with the motor max motoring and generating
torque curves.
6)The Pack voltage, current and Soc :
UDDS :
HWFET :
Conclusion :
The hybrid vehicle has been designed and the graph has been plotted for the analysis.