Project - Data Handling and Interpolation
ans-
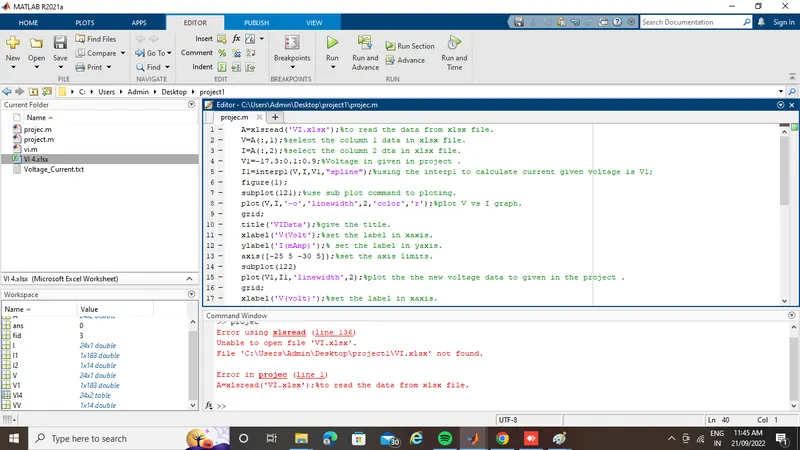
A=xlsread('VI.xlsx');%to read the data from xlsx file.
V=A(:,1);%select the column 1 data in xlsx file.
I=A(:,2);%select the column 2 dta in xlsx file.
V1=-17.3:0.1:0.9;%Voltage in given in project .
I1=interp1(V,I,V1,"spline");%using the interp1 to calculate current given voltage is V1;
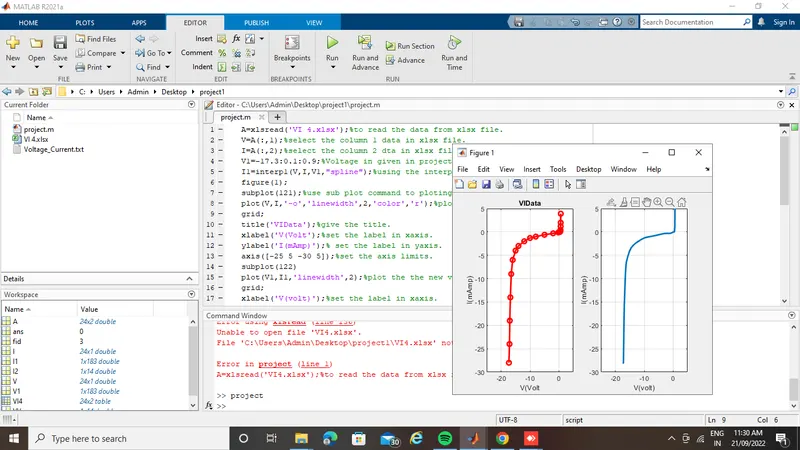
figure(1);
subplot(121);%use sub plot command to ploting.
plot(V,I,'-o','linewidth',2,'color','r');%plot V vs I graph.
grid;
title('VIData');%give the title.
xlabel('V(Volt');%set the label in xaxis.
ylabel('I(mAmp)');% set the label in yaxis.
axis([-25 5 -30 5]);%set the axis limits.
subplot(122)
plot(V1,I1,'linewidth',2);%plot the the new voltage data to given in the project .
grid;
xlabel('V(volt)');%set the label in xaxis.
ylabel('I(mAmp)');% set the label in yaxis.
title('Interpolation data');%set the title.
axis([-25 5 -30 5]);%set the axis limits.
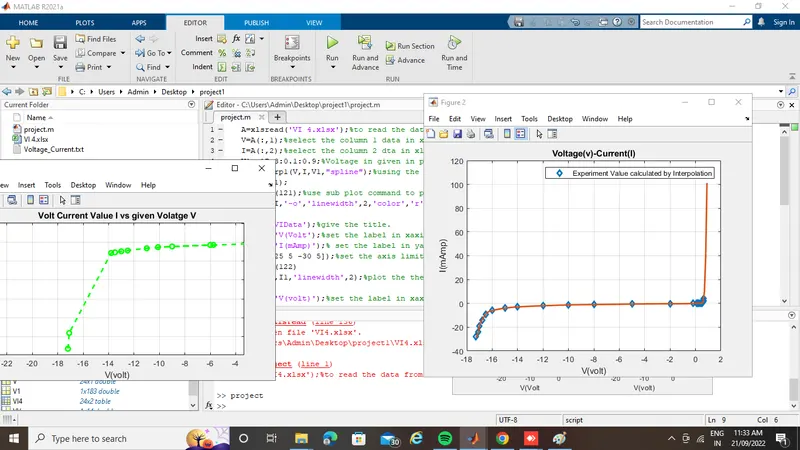
figure(2);
plot(V,I,'d',V1,I1,'linewidth',2);%plot the value.
grid;
legend('Experiment Value calculated by Interpolation');
title('Voltage(v)-Current(I)');%set the title.
xlabel('V(volt)');%label xaxis.
ylabel('I(mAmp)');%leabel Yaxis.
VV=[-17.2 -17.1 -13.8 -13.5 -13.0 -12.5 -11 -9 -5.76 -6 -10.11 0.25 0.5 0.61];%given voltage data in program.
I2=interp1(V,I,VV,"spline");%using the interp1 to calculate current given voltage.
figure(3);
plot(VV,I2,'O--','linewidth',2,'color','g');%plot the value.
grid;
xlabel('V(volt)');%set the label in xaxis.
ylabel('I(mAmp)');% set the label in yaxis.
title('Volt Current Value I vs given Volatge V');%set the title.
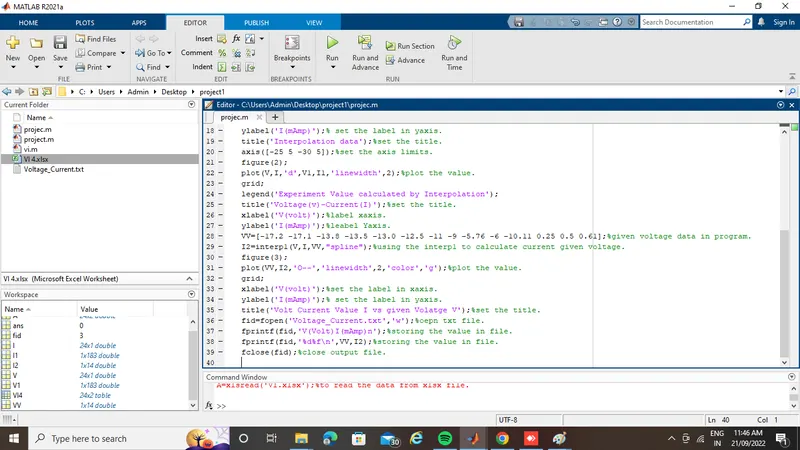
fid=fopen('Voltage_Current.txt','w');%oepn txt file.
fprintf(fid,'V(Volt)I(mAmp)n');%storing the value in file.
fprintf(fid,'%d%f\n',VV,I2);%storing the value in file.
fclose(fid);%close output file.
A=xlsread('VI.xlsx');%to read the data from xlsx file.
V=A(:,1);%select the column 1 data in xlsx file.
I=A(:,2);%select the column 2 dta in xlsx file.
V1=-17.3:0.1:0.9;%Voltage in given in project .
I1=interp1(V,I,V1,"spline");%using the interp1 to calculate current given voltage is V1;
figure(1);
subplot(121);%use sub plot command to ploting.
plot(V,I,'-o','linewidth',2,'color','r');%plot V vs I graph.
grid;
title('VIData');%give the title.
xlabel('V(Volt');%set the label in xaxis.
ylabel('I(mAmp)');% set the label in yaxis.
axis([-25 5 -30 5]);%set the axis limits.
subplot(122)
plot(V1,I1,'linewidth',2);%plot the the new voltage data to given in the project .
grid;
xlabel('V(volt)');%set the label in xaxis.
ylabel('I(mAmp)');% set the label in yaxis.
title('Interpolation data');%set the title.
axis([-25 5 -30 5]);%set the axis limits.
figure(2);
plot(V,I,'d',V1,I1,'linewidth',2);%plot the value.
grid;
legend('Experiment Value calculated by Interpolation');
title('Voltage(v)-Current(I)');%set the title.
xlabel('V(volt)');%label xaxis.
ylabel('I(mAmp)');%leabel Yaxis.
VV=[-17.2 -17.1 -13.8 -13.5 -13.0 -12.5 -11 -9 -5.76 -6 -10.11 0.25 0.5 0.61];%given voltage data in program.
I2=interp1(V,I,VV,"spline");%using the interp1 to calculate current given voltage.
figure(3);
plot(VV,I2,'O--','linewidth',2,'color','g');%plot the value.
grid;
xlabel('V(volt)');%set the label in xaxis.
ylabel('I(mAmp)');% set the label in yaxis.
title('Volt Current Value I vs given Volatge V');%set the title.
fid=fopen('Voltage_Current.txt','w');%oepn txt file.
fprintf(fid,'V(Volt)I(mAmp)n');%storing the value in file.
fprintf(fid,'%d%f\n',VV,I2);%storing the value in file.
fclose(fid);%close output file.
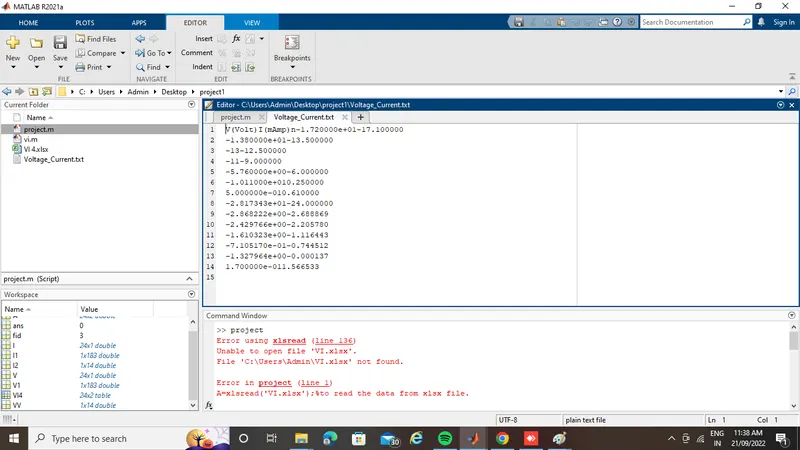
V(Volt)I(mAmp)n-1.720000e+01-17.100000
-1.380000e+01-13.500000
-13-12.500000
-11-9.000000
-5.760000e+00-6.000000
-1.011000e+010.250000
5.000000e-010.610000
-2.817343e+01-24.000000
-2.868222e+00-2.688869
-2.429766e+00-2.205780
-1.610323e+00-1.116443
-7.105170e-01-0.744512
-1.327964e+00-0.000137
1.700000e-011.566533