Project - Data Handling and Interpolation
FINAL PROJECT:
Problem statement:
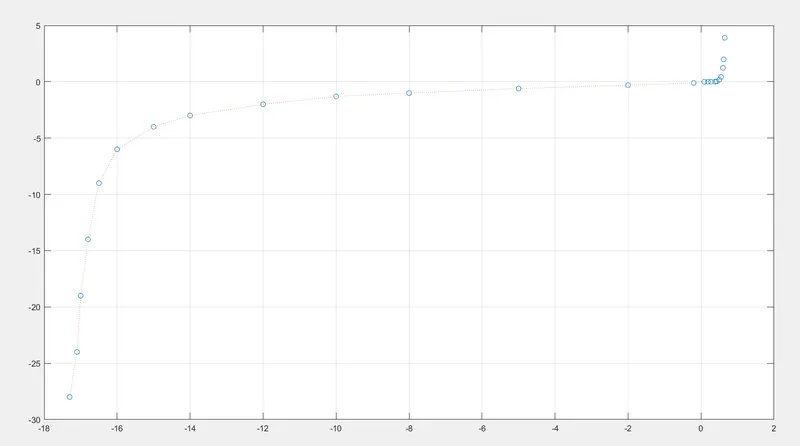
In a laboratory experiment, data of voltage and current has been recorded and the same is attached in an excel file ( Click on this link VI.xlsx ). Read the excel file in the Matlab program and perform the interpolation in the range of -17.3:0.1:0.9. Generate the interactive plot for the interpolated data and store them in a text file.
Key Highlights:
- Graphical solutions are more visual and appealing
- Interpolation of data
- Read excel file
- Write to text file
Deliverables:
- Find missing data and save it in text
- Interpolate the data set
- Save your program and attach the same.
- Save txt file and upload in attachment
Aim:
To experiment the data of voltage and current has been recorded and the same is attached in an excel file and read the excel file in the Matlab program and perform the interpolation in the range of -17.3:0.1:0.9. Generate the interactive plot for the interpolated data and store them in a text file.
Matlab code:
clc;
clear all;
ex = xlsread('VI.xlsx');%To read the spreedsheet
v=ex(:,1)%To acess the first column(voltage) of the spreedsheet
i=ex(:,2)%To acess the second column(current) of the spreedsheet
v_interp = [-17.3:0.1:0.9]; %Time duration with the interval of 0.1
i_interp=interp1(v,i,v_interp)%interpolation with the inputs
plot(v,i,'o',v_interp,i_interp,':');%To get the output as a graph
grid;%for specified lines
data=[i_interp;v_interp];%Two coulmn for interpolation of voltage and current
fileID = fopen('interpt.txt','w'); %To create a new file
fprintf(fileID,'%f %f \n',data);%print the output of the interpolation voltage and current
interp1 command-Two dimensional interpolation.
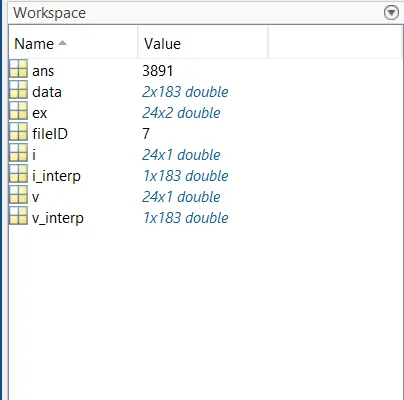
Workspace variables
Output plot:
Conclusion:
Thus the matlab program and the missing data of voltage,current with the interpolation, all are completed and verified successfully.