Project - Data Handling and Interpolation
Project- Data Handling and Interpolation.
Answer-
% Project - Data Handling and Interpolation.
clc;                                             %clear the command window.
clear all;                                       %closes all figure windows.
Data= xlsread('VI.xlsx');                        %Reading the xlsx file.
V = Data(:,1);                                   %storing first column value of 'data' in 'V'.
I = Data(:,2);                                   %storing second column value of 'data' in 'A'.
Vinp = -17.3:0.1:0.9;                            %Given this Range of Voltage in problem.
Iinp = interp1(V,I,Vinp,"spline");               % Using 'interp1' function for calculating Current value for given Voltage Range 'Vinp'

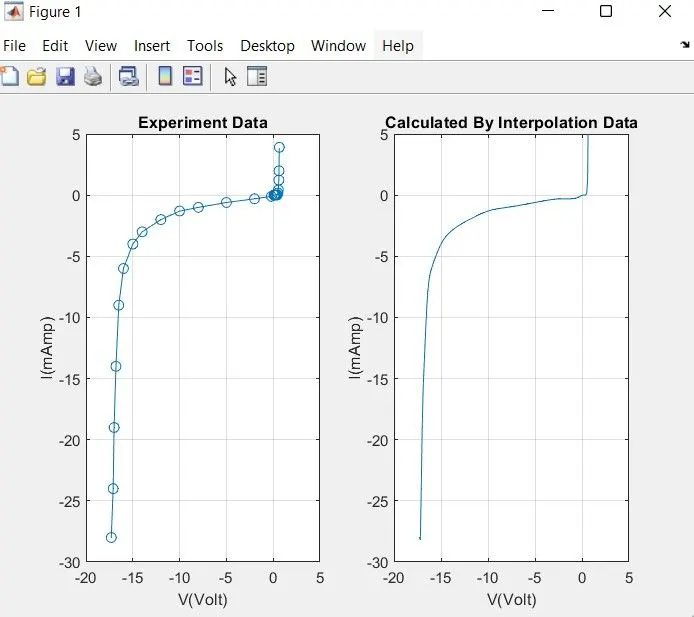
figure(1);
subplot(121)                                     %Subploting matrix.
plot(V,I,'-o');                                  %Ploting Voltage(V) & Current(I)using trig_function.
title('Experiment Data');                        %Giving title for the graph.
xlabel('V(Volt)');                               %Giving lable for X-axis i.e voltage
ylabel('I(mAmp)');                               %Giving lable for Y-axis i.e current.
axis([-20 5 -30 5]);                             %Defining axis limits.
grid;                                            %Give grid to graph.

subplot(122)
plot(Vinp,Iinp);                                 %Ploting Interpolation voltage& Interpolation current using trig_function.
title('Calculated By Interpolation Data');       %Giving title for the graph.
xlabel('V(Volt)');                               %Giving lable for X-axis i.e voltage.
ylabel('I(mAmp)');                               %%Giving lable for X-axis i.e current.
axis([-20 5 -30 5]);                             %Defining axis limits.
grid;                                            %Give grid to graph.

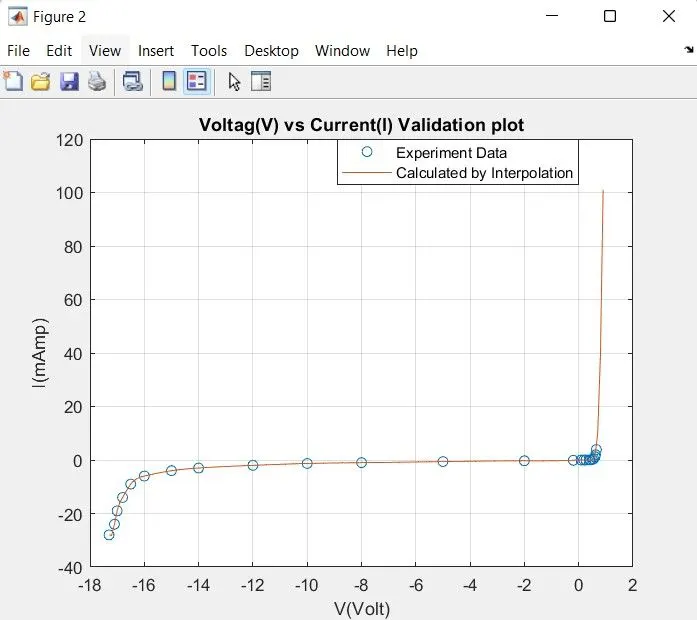
figure(2);
plot(V,I,'o',Vinp,Iinp);                         %ploting the values of voltage,current,inter.voltage& inter.current using trig_function.
title('Voltag(V) vs Current(I) Validation plot');%Giving title for the combine graph.
xlabel('V(Volt)');                               %Giving lable for X-axis i.e voltage.
ylabel('I(mAmp)');                               %Giving lable for Y-axis i.e current.
legend('Experiment Data','Calculated by Interpolation');% Showing legends on graph.
grid;
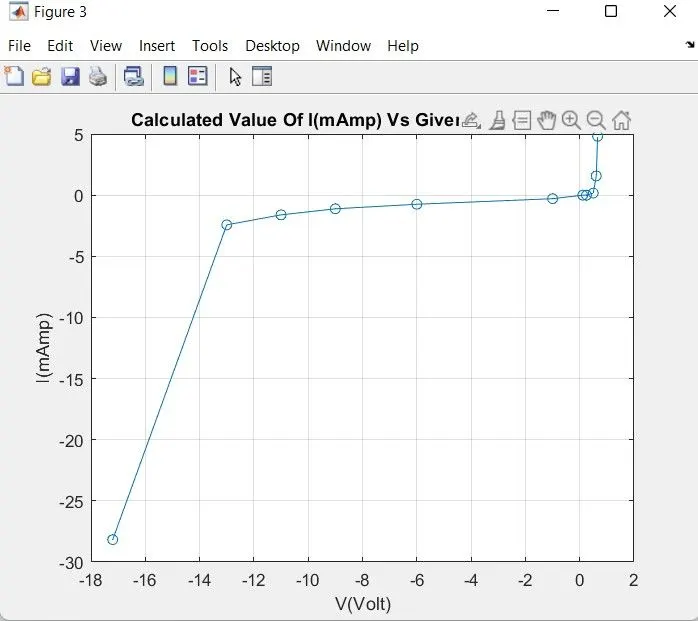
VV =[-17.2 -13 -11 -9 -6 -1 0.11 0.25 0.5 0.61 0.66];% Given Voltage Data in problem
VI = interp1(V,I,VV,"spline");                   % Using 'interp1' function for calculating Current value for given Voltage.

figure(3);
plot(VV,VI,'-o');                                %ploting the new values of voltage, current using trig_function.
title('Calculated Value Of I(mAmp) Vs Given data of V(Volt)');%Giving title for the combine graph.
xlabel('V(Volt)');                               %Giving lable for X-axis i.e voltage.
ylabel('I(mAmp)');                               %Giving lable for Y-axis i.e Current.
grid;
Output- The output for the above program is shown below-