Project - Data Handling and Interpolation
AIM
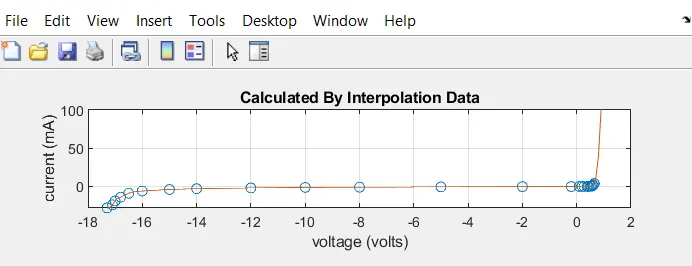
- Read the excel file in the Matlab program and perform the interpolation and to generate plot for the interpolated data and store them in a text file.
THEORY
Interpolation
Interpolation is a method of deriving a simple function from the given discrete data set such that the function passes through the provided data points. This helps to determine the data points in between the given data ones. This method is always needed to compute the value of a function for an intermediate value of the independent function. In short, interpolation is a process of determining the unknown values that lie in between the known data points. It is mostly used to predict the unknown values for any geographical related data points such as noise level, rainfall, elevation, and so on.
Types of interpolation method are
- Linear interpolation
- Nearest neighbour interpolation or Piecewise constant interpolation
- Polynomial interpolation
- Spline interpolation
- Mimetic interpolation
1. Linear interpolation
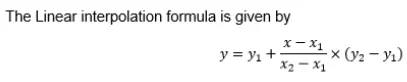
The Linear Interpolation Method applies a distinct linear polynomial between each pair of the given data points for the curves, or within the sets of three points
2. Nearest Nehibour Method
In this method the value of an interpolated point is inserted to the value of the most adjacent data point.Therefore the nearest neighbour method does not produce any new data points.
3.Polynomial interpolation
It is a method of estimating values between known data points. When graphical data contains a gap, but data is available on either side of the gap or at a few specific points within the gap, an estimate of values within the gap can be made by interpolation.
4. Mimetic interpolation
It is a method for interpolating differential forms. In contrast to other interpolation methods, which estimate a field at a location given its values on neighboring points, mimetic interpolation estimates the field's k -form given the field's projection on neighboring grid elements. The grid elements can be grid points as well as cell edges or faces, depending on k=1,2,3...
interp1
It is used in 1-D data interpolation.
syntax
vq = interp1(x,v,xq)x contains the sample points, and v contains the corresponding values, v(x). Vector xq contains the coordinates of the query points.
If you have multiple sets of data that are sampled at the same point coordinates, then you can pass v as an array. Each column of array v contains a different set of 1-D sample values.
vq = interp1(x,v,xq,method)'linear', 'nearest', 'next', 'previous', 'pchip', 'cubic', 'v5cubic', 'makima', or 'spline'. The default method is 'linear'.
vq = interp1(x,v,xq,method,extrapolation)x. Set extrapolation to 'extrap' when you want to use the method algorithm for extrapolation. Alternatively, you can specify a scalar value, in which case, interp1 returns that value for all points outside the domain of x.
vq = interp1(v,xq)1 to n, where n depends on the shape of v:
-
When v is a vector, the default points are
1:length(v). -
When v is an array, the default points are
1:size(v,1).
vq = interp1(v,xq,method)
vq = interp1(v,xq,method,extrapolation)
pp = interp1(x,v,method,'pp')method algorithm.
interp2
It is used in interpolation for 2-D gridded data in meshgrid format.
Syntax
Vq = interp2(X,Y,V,Xq,Yq)X and Y contain the coordinates of the sample points. V contains the corresponding function values at each sample point. Xq and Yq contain the coordinates of the query points.Vq = interp2(V,Xq,Yq)X=1:n and Y=1:m, where [m,n] = size(V). Use this syntax when you want to conserve memory and are not concerned about the absolute distances between points.Vq = interp2(V)Vq = interp2(V,k)k times in each dimension. This results in 2^k-1 interpolated points between sample values.Vq = interp2(___,method)'linear', 'nearest', 'cubic', 'makima', or 'spline'. The default method is 'linear'.Vq = interp2(___,method,extrapval)extrapval, a scalar value that is assigned to all queries that lie outside the domain of the sample points.If you omit the extrapval argument for queries outside the domain of the sample points, then based on the method argument interp2 returns one of the following:
-
Extrapolated values for the
'spline'and'makima'methods -
NaNvalues for other interpolation methods
PROGRAM CODE:
clc
clear all
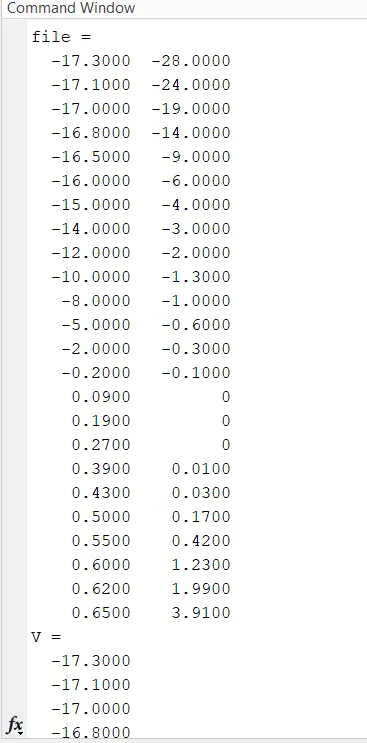
file=xlsread('VI.xlsx') % Read the current values from VI.xls file
format compact; % the data format is kept compact form
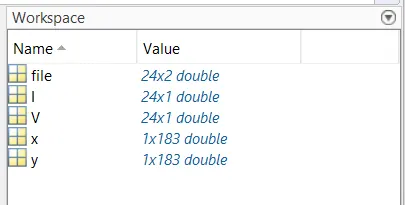
V=file(:,1) %1st column of file is assigned to V
I=file(:,2) %2nd column of file is assigned to V
x=-17.3:0.1:0.9;
y=interp1(V,I,x,'spline'); %spline curve
subplot(311);
plot(V,I,'o', x,y) %plote the V v/s I with(o) & interpolation values
grid on
title('Calculated By Interpolation Data') %giving title for the figure
xlabel('voltage (volts)') %labeling X and Y axis
ylabel('current (mA)')
grid on
 o
o
OUTPUT: