Project - Data Handling and Interpolation
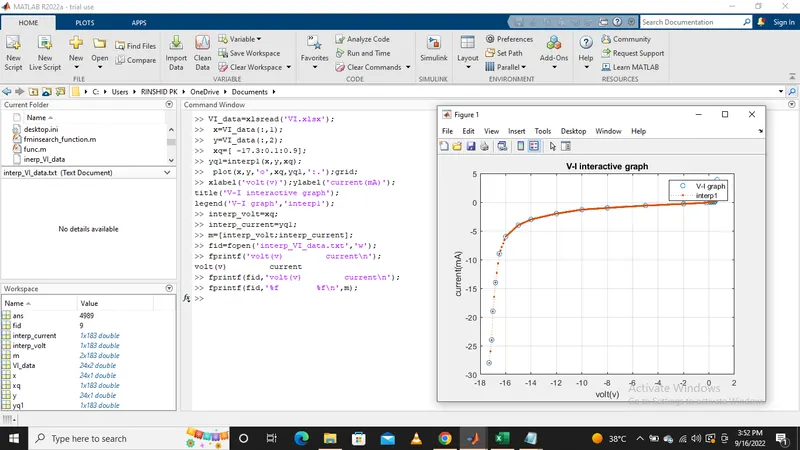
>> VI_data=xlsread('VI.xlsx');%xlsread function reads data from .xlsx sheet
>> x=VI_data(:,1);%assingned first colmn of the matrix values are x
>> y=VI_data(:,2);%assingned second colmn of the matrix values are y
>> xq=[ -17.3:0.1:0.9];%interpolation range
>> yq1=interp1(x,y,xq);%interp1 teqnique is used for getting unkown values between the range xq
>> plot(x,y,'o',xq,yq1,':.');
>> xlabel('volt(v)');ylabel('current(mA)');
title('V-I interactive graph');
legend('V-I graph','interp1');
>> interp_volt=xq;%xq is our voltage values
>> interp_current=yq1;%yq1 is our current values curresponding to xq
>> m=[interp_volt;interp_current];
>> fid=fopen('interp_VI_data.txt','w');%opened the txt file in write mode
%printing data into the text file using fprintf command
>> fprintf('volt(v) currentn');
volt(v) current
>> fprintf(fid,'volt(v) currentn');
>> fprintf(fid,'%f %fn',m);
>> fclose(fid);
>>