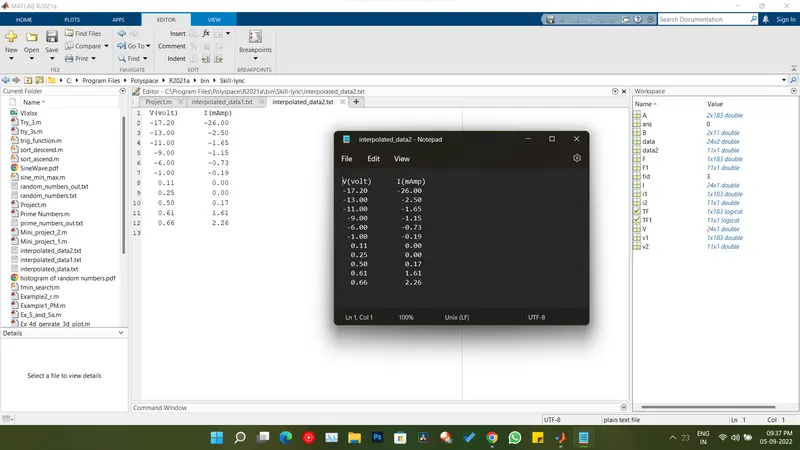
Project - Data Handling and Interpolation
Project - Data Handling and Interpolation
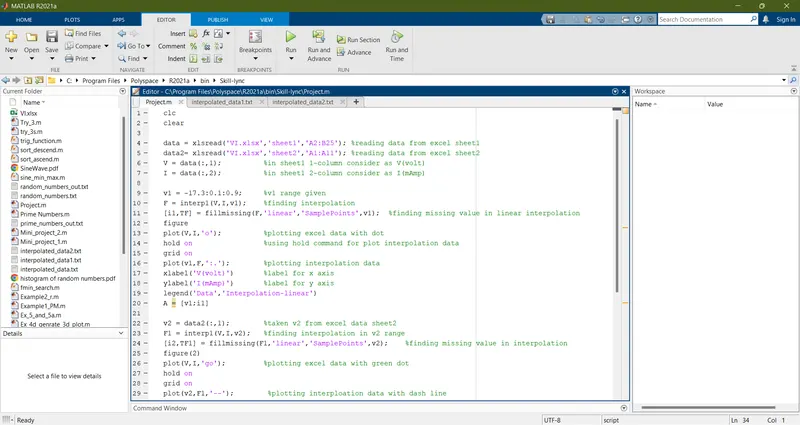
clc
clear
data = xlsread('VI.xlsx','sheet1','A2:B25'); %reading data from excel sheet1
data2= xlsread('VI.xlsx','sheet2','A1:A11'); %reading data from excel sheet2
V = data(:,1); %in sheet1 1-column consider as V(volt)
I = data(:,2); %in sheet1 2-column consider as I(mAmp)
v1 = -17.3:0.1:0.9; %v1 range given
F = interp1(V,I,v1); %finding interpolation
[i1,TF] = fillmissing(F,'linear','SamplePoints',v1); %finding missing value in linear interpolation
figure
plot(V,I,'o'); %plotting excel data with dot
hold on %using hold command for plot interpolation data
grid on
plot(v1,F,':.'); %plotting interpolation data
xlabel('V(volt)') %label for x axis
ylabel('I(mAmp)') %label for y axis
legend('Data','Interpolation-linear')
A = [v1;i1]
v2 = data2(:,1); %taken v2 from excel data sheet2
F1 = interp1(V,I,v2); %finding interpolation in v2 range
[i2,TF1] = fillmissing(F1,'linear','SamplePoints',v2); %finding missing value in interpolation
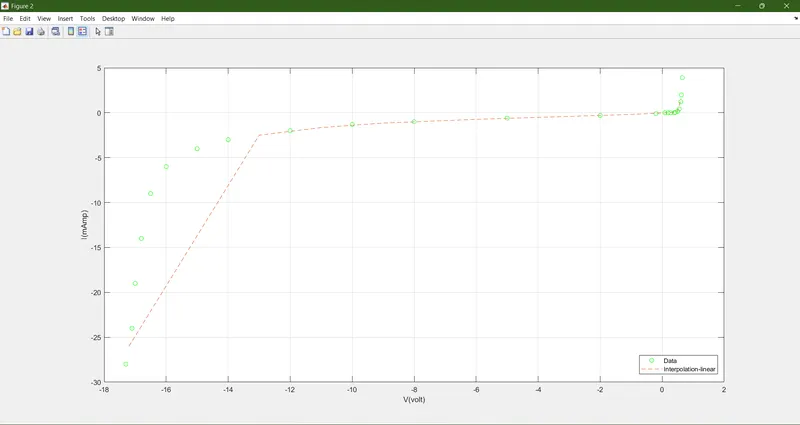
figure(2)
plot(V,I,'go'); %plotting excel data with green dot
hold on
grid on
plot(v2,F1,'--'); %plotting interploation data with dash line
xlabel('V(volt)')
ylabel('I(mAmp)')
legend('Data','Interpolation-linear')
B = [v2';i2']
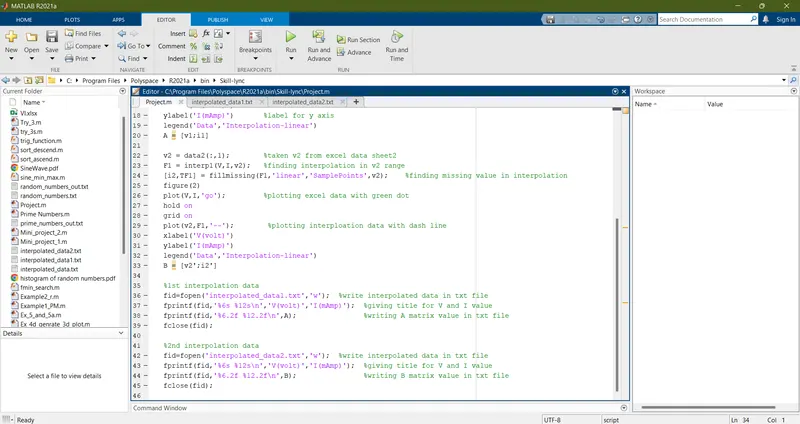
%1st interpolation data
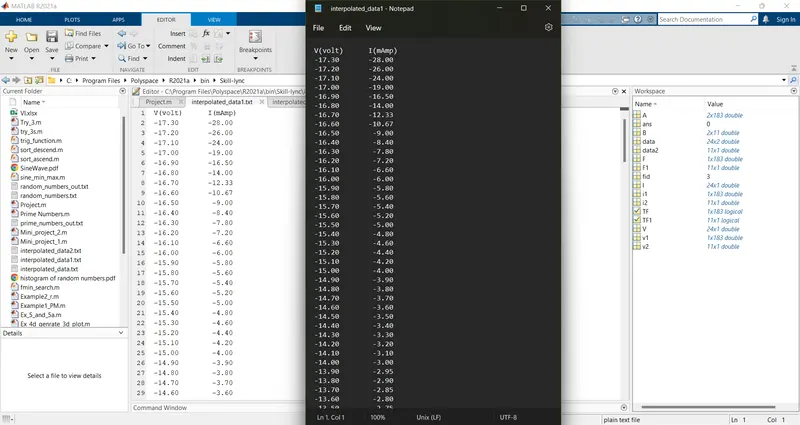
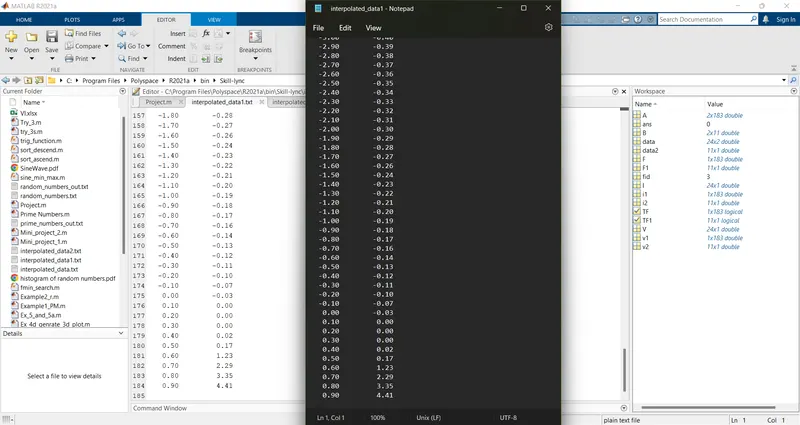
fid=fopen('interpolated_data1.txt','w'); %write interpolated data in txt file
fprintf(fid,'%6s %12sn','V(volt)','I(mAmp)'); %giving title for V and I value
fprintf(fid,'%6.2f %12.2fn',A); %writing A matrix value in txt file
fclose(fid);
%2nd interpolation data
fid=fopen('interpolated_data2.txt','w'); %write interpolated data in txt file
fprintf(fid,'%6s %12sn','V(volt)','I(mAmp)'); %giving title for V and I value
fprintf(fid,'%6.2f %12.2fn',B); %writing B matrix value in txt file
fclose(fid);
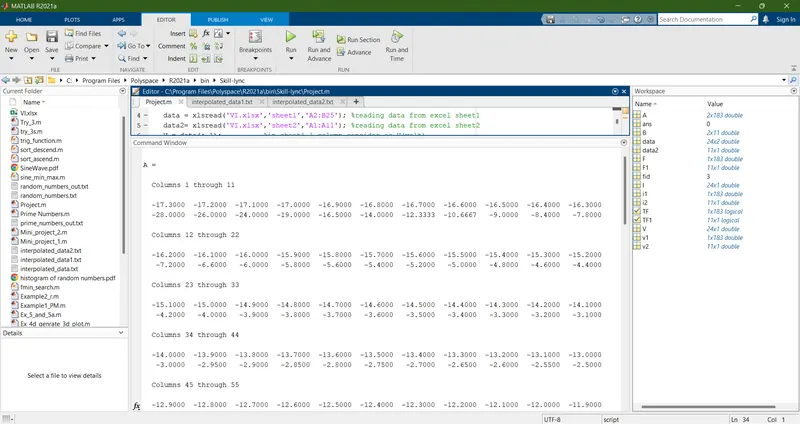
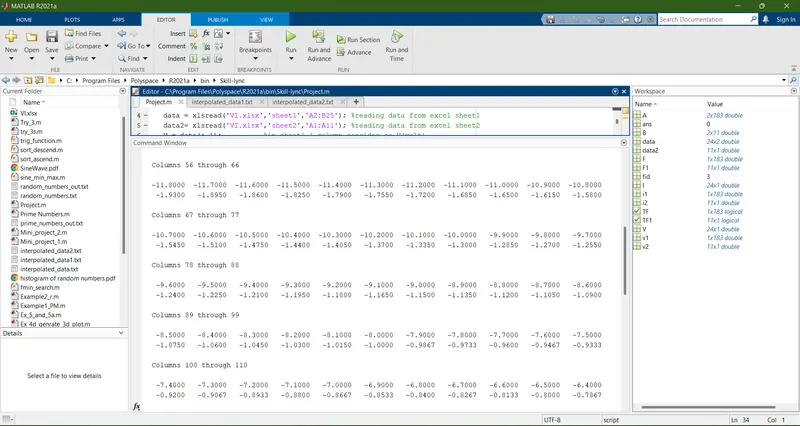
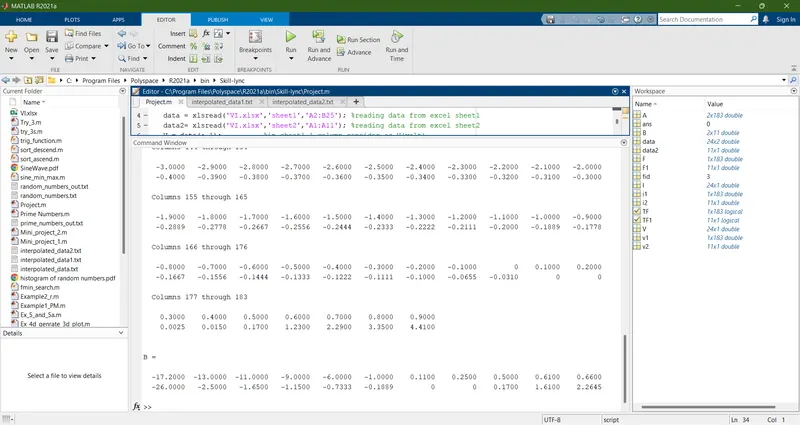
- 1ST AND 2ND INTERPOLATION GRAPH
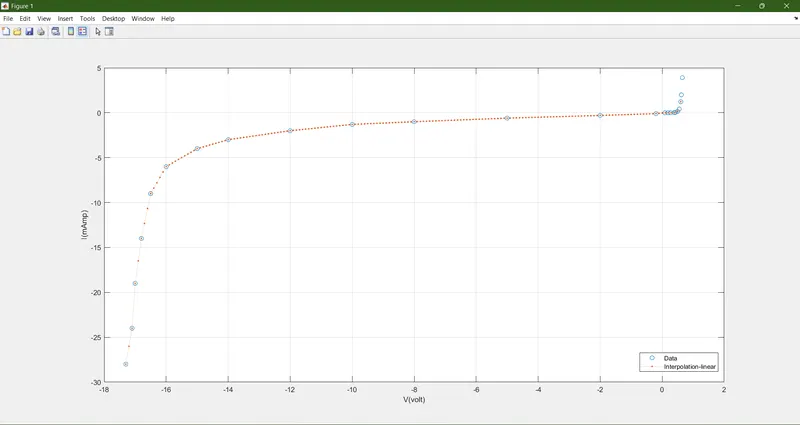
- 1ST INTERPOLATION
- 2ND INTERPOLATION