Project - Data Handling and Interpolation
Project
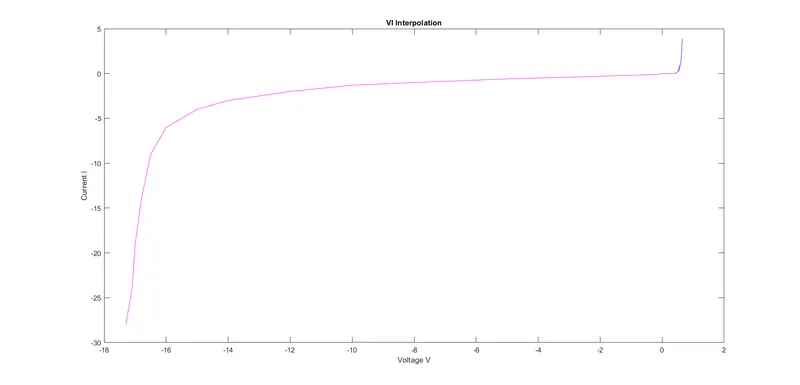
Objective: In a laboratory experiment, data of voltage and current has been recorded and the same is attached in an excel file. Read the excel file in the Matlab program and perform the interpolation in the range of -17.3:0.1:0.9. Generate the interactive plot for the interpolated data and store them in a text file.
The data:
| V (Volt) | I (mAmp) |
| -17.3 | -28 |
| -17.1 | -24 |
| -17 | -19 |
| -16.8 | -14 |
| -16.5 | -9 |
| -16 | -6 |
| -15 | -4 |
| -14 | -3 |
| -12 | -2 |
| -10 | -1.3 |
| -8 | -1 |
| -5 | -0.6 |
| -2 | -0.3 |
| -0.2 | -0.1 |
| 0.09 | 0 |
| 0.19 | 0 |
| 0.27 | 0 |
| 0.39 | 0.01 |
| 0.43 | 0.03 |
| 0.5 | 0.17 |
| 0.55 | 0.42 |
| 0.6 | 1.23 |
| 0.62 | 1.99 |
| 0.65 | 3.91 |
Solution:
The code:
% Importing the input excel file to a .mat file and loading it in the script first up
load('VI.mat')
% Extracting the first column of the file which carries the voltage values
v=VI(:,1);
% Extracting the second column of the file which carries the current values
i=VI(:,2);
% The required voltage range to be interpolated against
vq=[-17.3:0.1:.9];
% Interpolated current values
iq=interp1(v,i,vq);
Z=[vq;iq];
% Plotting
plot(v,i,'b-',vq,iq,'m-');
title('VI Interpolation')
xlabel('Voltage V')
ylabel('Current I')

% Saving the values to an output text file
% Opening a file to be written the data to
fid=fopen('vioutput.txt','w')
% Printing the values in the output file
fprintf(fid,'%5s %8s\r\n','V','I')
fprintf(fid,'%4.4f %4.4f\r\n',Z)
% Closing the file
fclose(fid)
Output:
References:
Matlab Documentation