Project - A project on design of road from a given topographic data
Answer 1: Point creation and grouping them with the help of description.
- In Civil 3d, there are many ways in which we can create points. As a highway engineer we get data in different forms. It can be a .CSV file or the points can be present in the form of drawing objects.
- We will use the .csv file to import the points and the we will create point groups with the help of description.
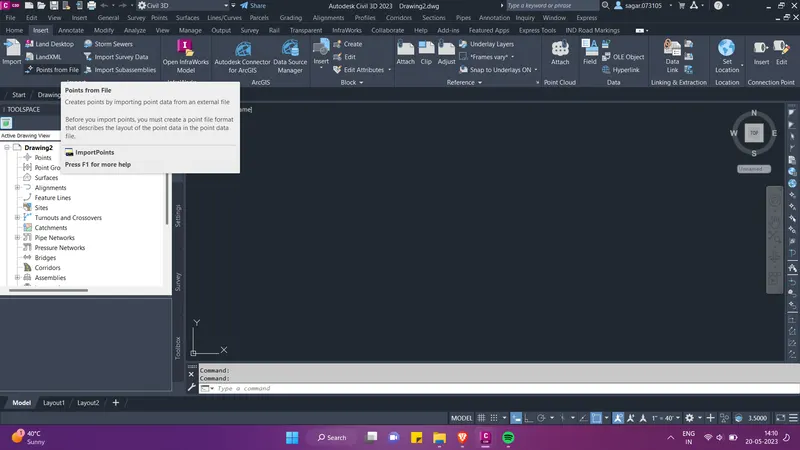
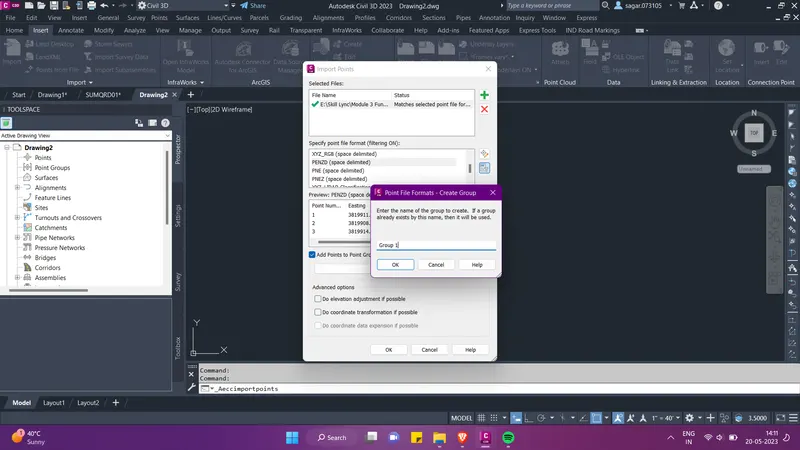
- For importing the points, go to insert option in the ribbion and select the option "points from file". The a pop-up menu will appear as shown below. Select the survey points file by clicking on the plus sign.
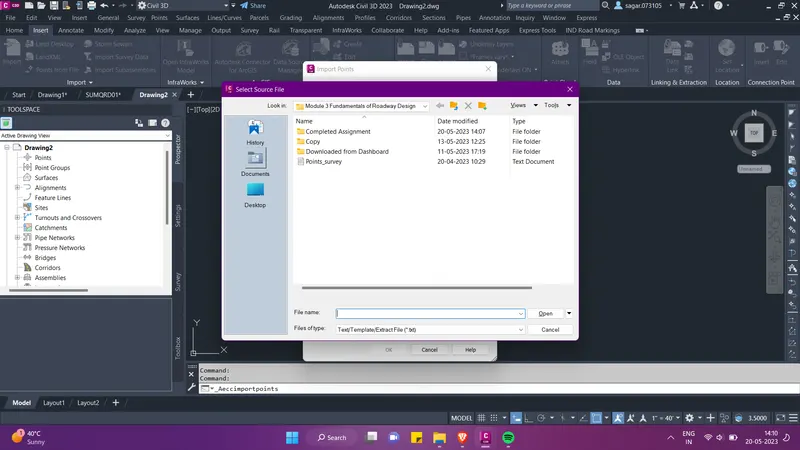
- Then set the format in which the .csv is arranged. We can create the group in this menu itself. Then click on OK.
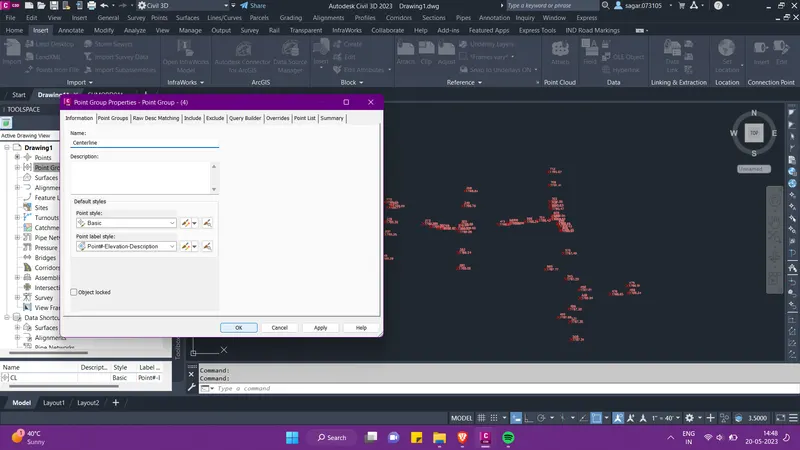
- Then in the porspector tab, select the point group option, right click and click on "New". Then create a new point group by the name Centerline. All the centerline points will stay in this group.
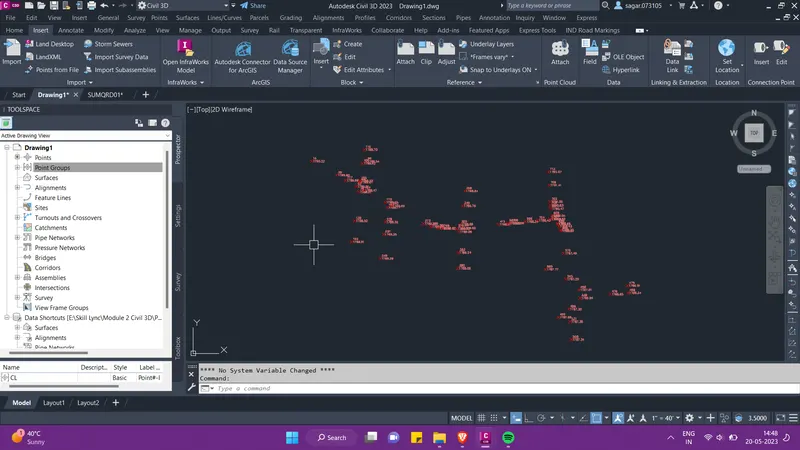
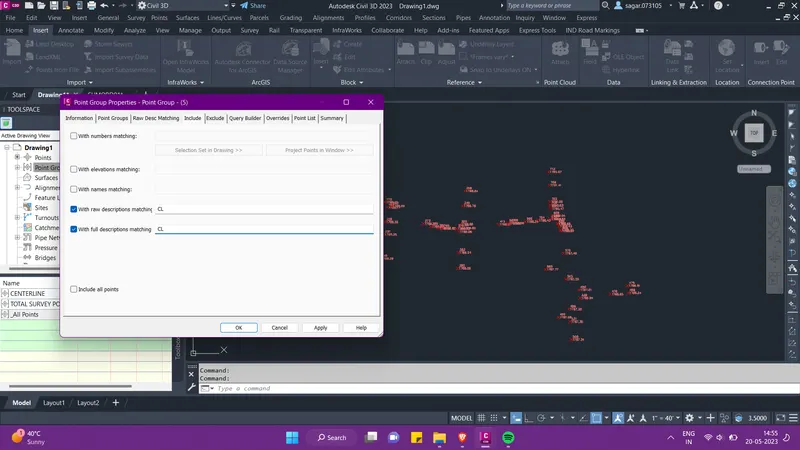
- Then in the same menu go to include tab, check the options as shown in the image below and include CL points.
- Then in the same menu go to exclude tab, and exclude all the other points i.e. SW, DB, DT etc points. We can create seperate point groups for these points.
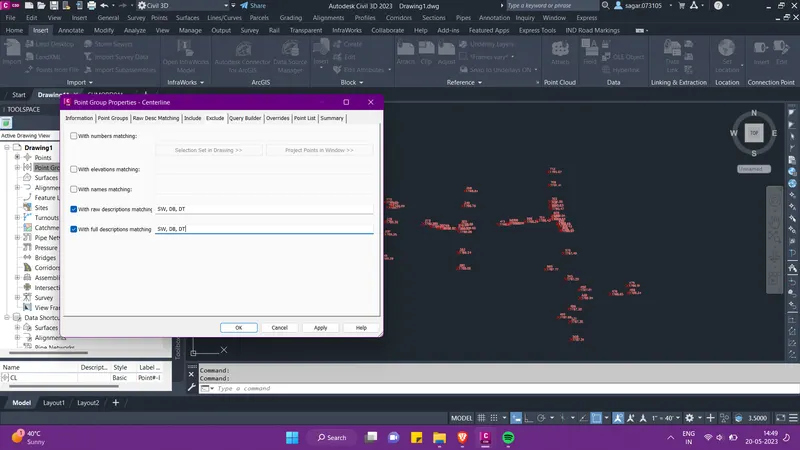
- Then click on Apply and OK. Then in the tool space we can observe that when we select the point group that we just created, it starts to show all the CL points only.
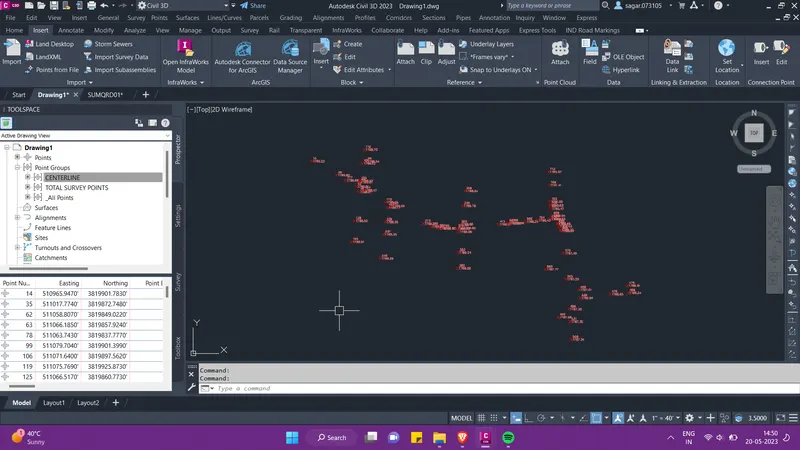
- In the same manner we can create point group for all the other points. This helps when we want to see only a specific set of points.
Answer 2: Preparation of surface and importance of breaklines.
- For the preparation of surface, go to the prospector tab in the Tool space, right click on the surfaces option and select "create surfaces"
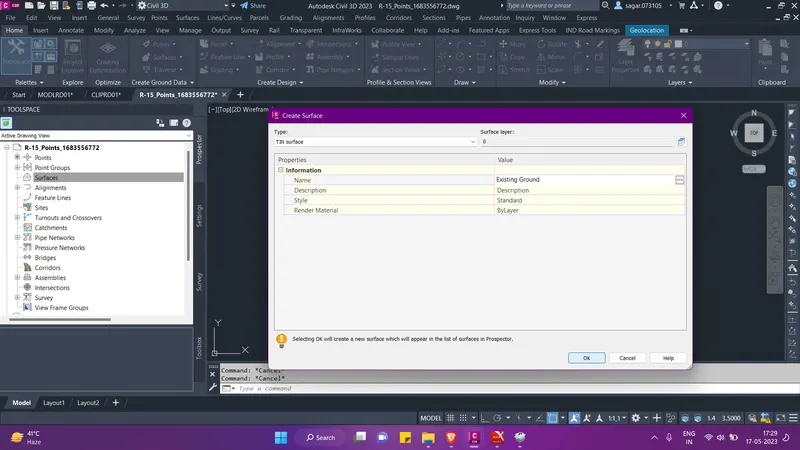
- Then from the pop-up menu, give the name of the surface as Existing ground and click OK. Hence the surface is created. Now expand the created surface and then expand the definations option. Here we will define the drawing objects. Then under the definations option, go to drawing objects, right click and select "add".
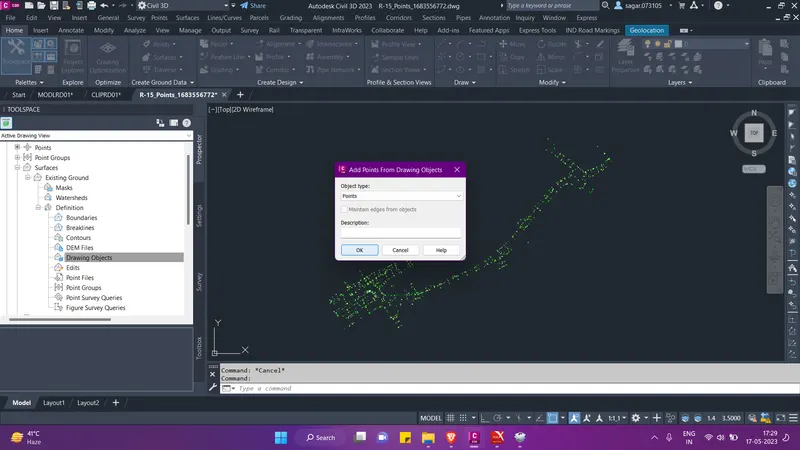
- Now since we have autocad points as our data, hence we will select points as object type and click on OK. Then the points data will be added to the surface.
- Now we will also define the breakiline in our surface. Breaklines play a crucial role in creating accurate and realistic surfaces in various fields such as topographic mapping, civil engineering, and computer graphics. Breaklines are essentially lines or 3d polylines that represent changes in elevation or slope on a surface. They are used to define abrupt changes in the terrain or to represent features such as ridges, valleys, ditches, roads, and rivers.
- So, first we will identify the centerline points and the road edge points in the drawing. We can select one centerline point first, right click and go to select similar option. Then all the centerline points will be selected. Then again right click and select isolate selected objects.
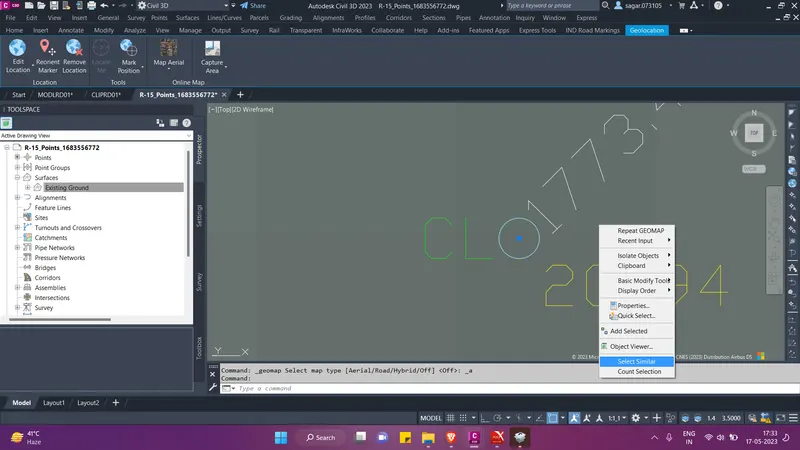
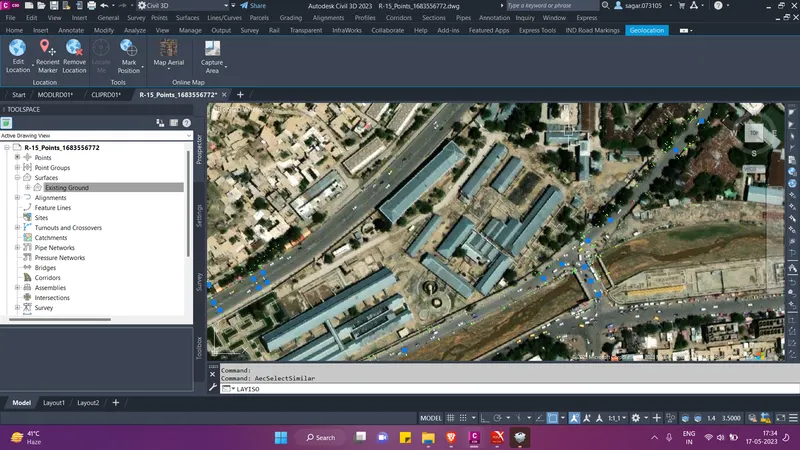
- Then only the centerline points will be visible. Then by turning on the geolocation and taking the aerial map as reference we will join these centerline points by 3d polylines. Type 3dpoly in the command line and join the points. Do the same for road edge points.
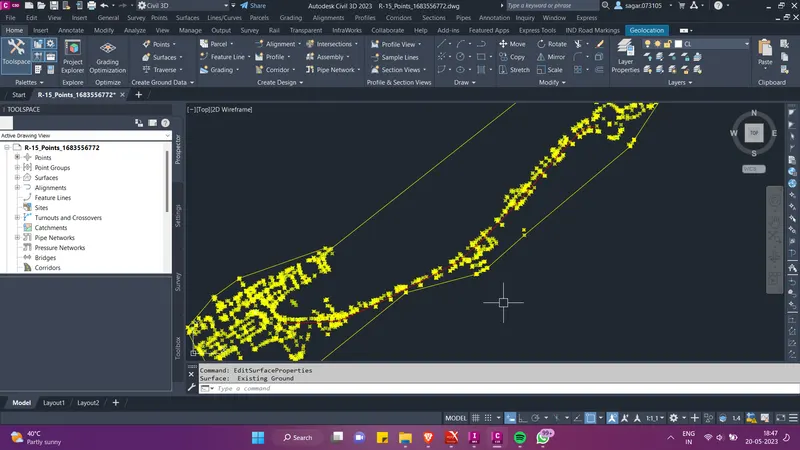
- After joining all the points through 3d polylines, we will add it as a breakline in our created surface. For this go to the prospector tab and under our created surface go to definations, right click on the breakline option. From the pop-up menu give the name as BL Center. and click on OK.
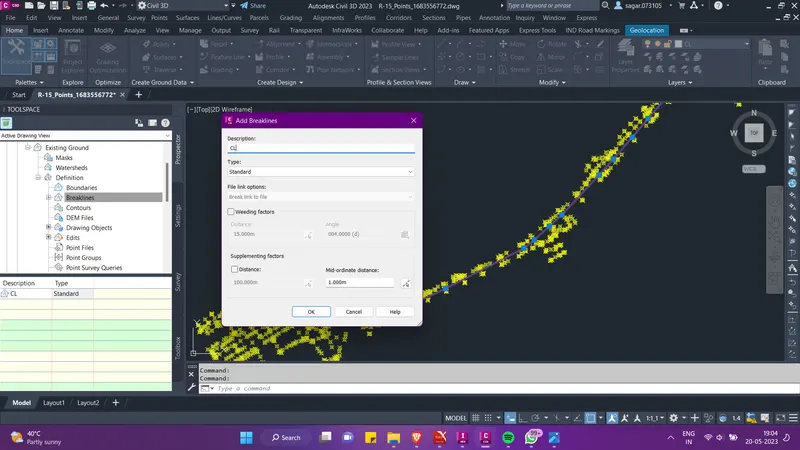
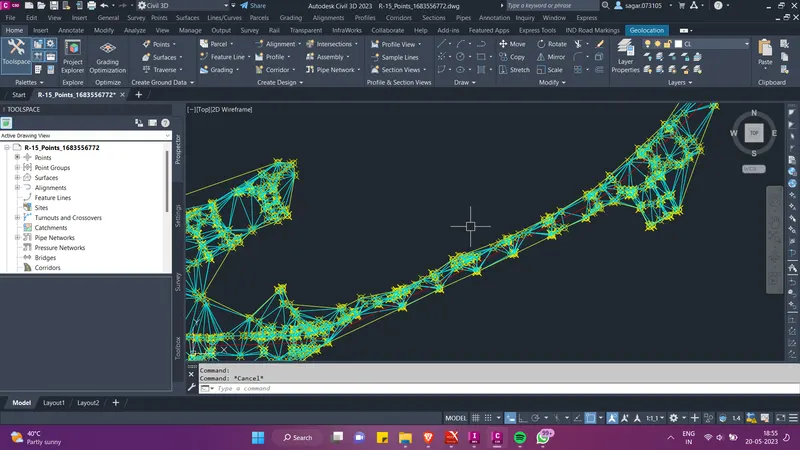
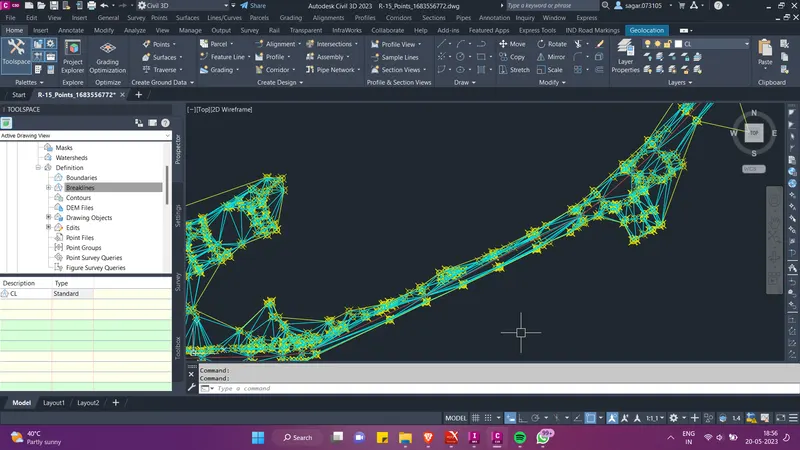
- We can observe in the above images that the surface changes and becomes topographically accurate as we add breaklines to it. Similarly if we add breaklines for edge of pavement to then we can get a more accurate surface which is triangulated in a better way.
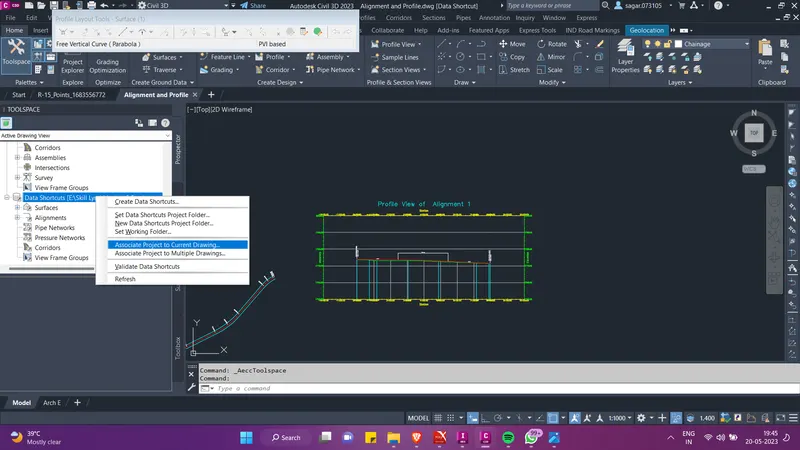
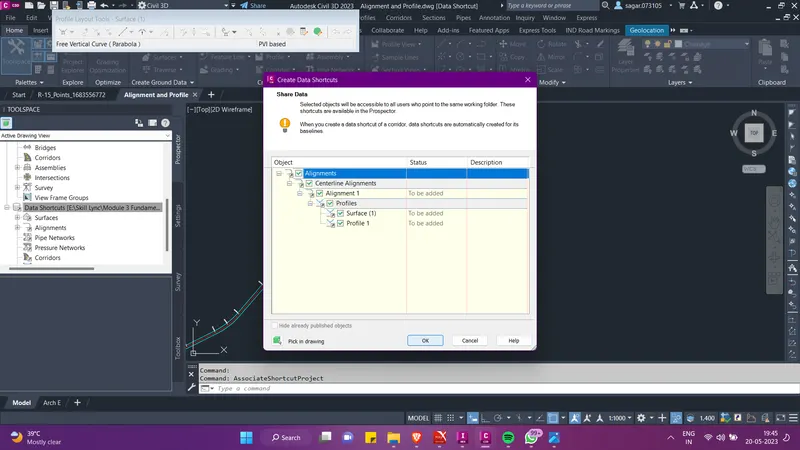
- Then we will create data shortcut of this file and use it as a reference in our alignment file to create the alignment and profile.
Answer 3: Horizontal alignment design and adding super elevation
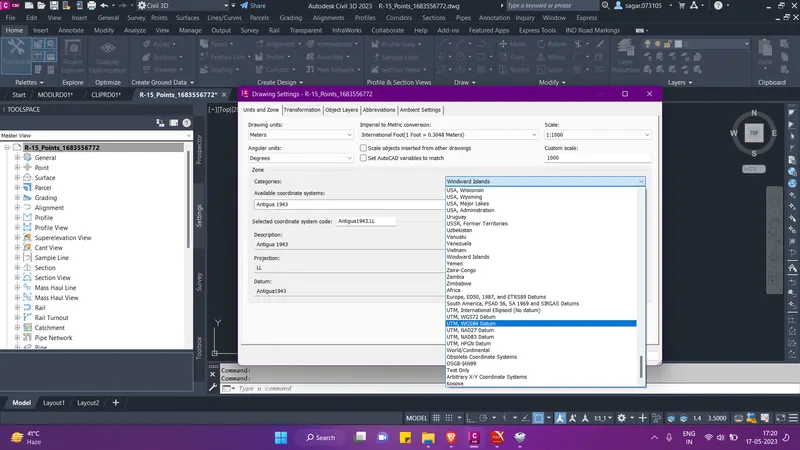
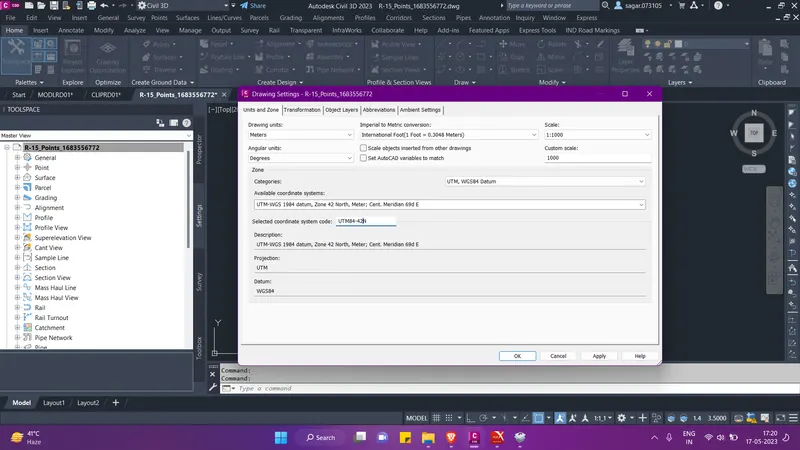
- Now, after the creation of surface, we will create the alignment of the road. For this create new file by the name ALGNRD01 and create reference of the survey surface. Set the co-ordinate system.
- Now for the creation of alignment, click on alignment option under create design palete in Home tab. Then click on alignment creation tools option. In the pop-up menu give the name of the alignment and set the desired alignment styles. Set alignment style for centerline alignment. Go to design criteria option, set the design speed and then click on OK.
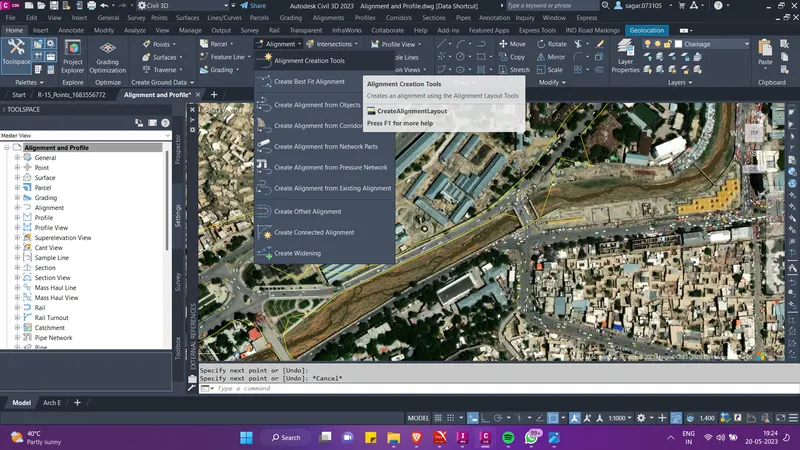
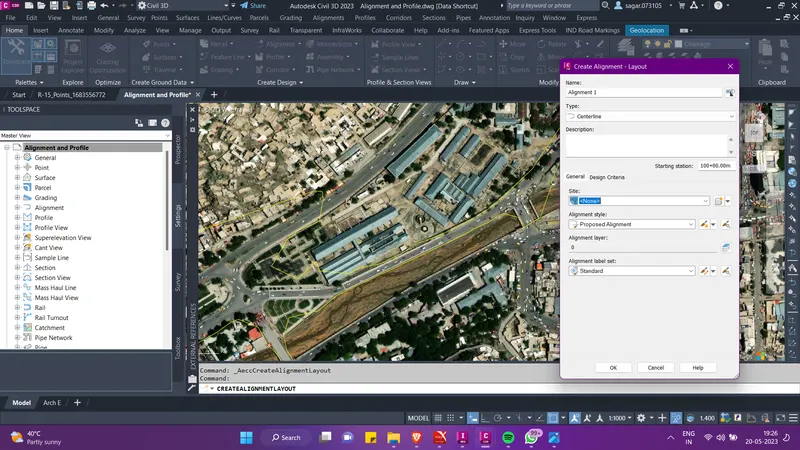
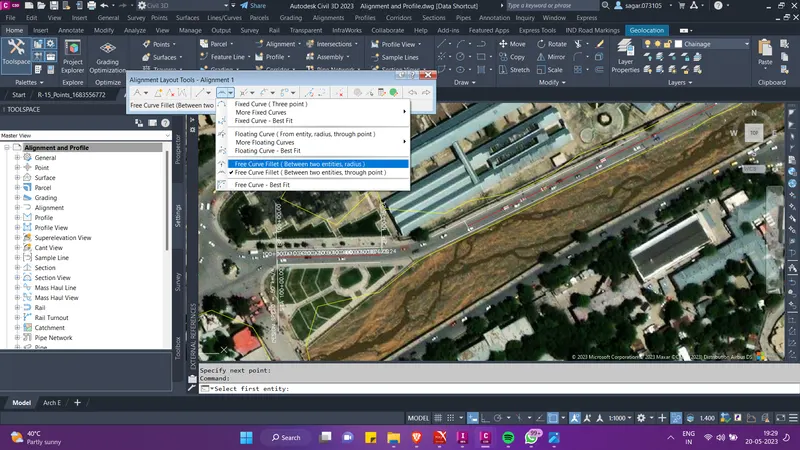
- A tool palete will appear on the screen. Use these tools to create the desried alignment. Follow the steps below.
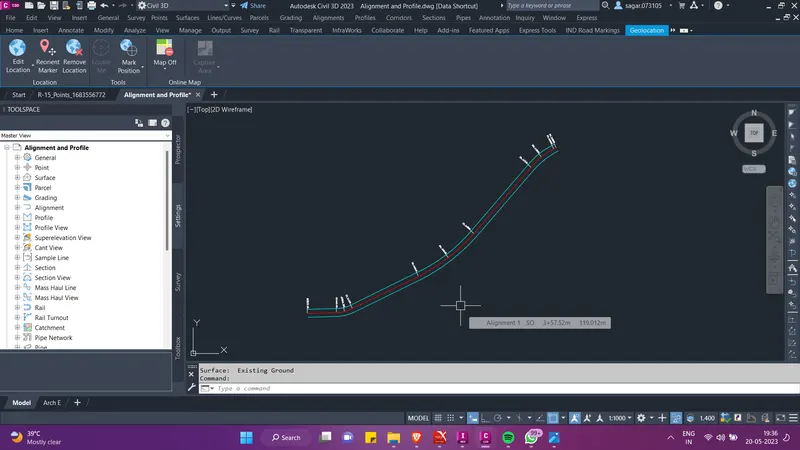
- Then on turning off the geo location we can see in the above image that the desired alignment has been created.
- Now we will provide superelevation to the centerline alignment. For this, select the centerline alignment and for the contextual ribbion select the superelevation option.
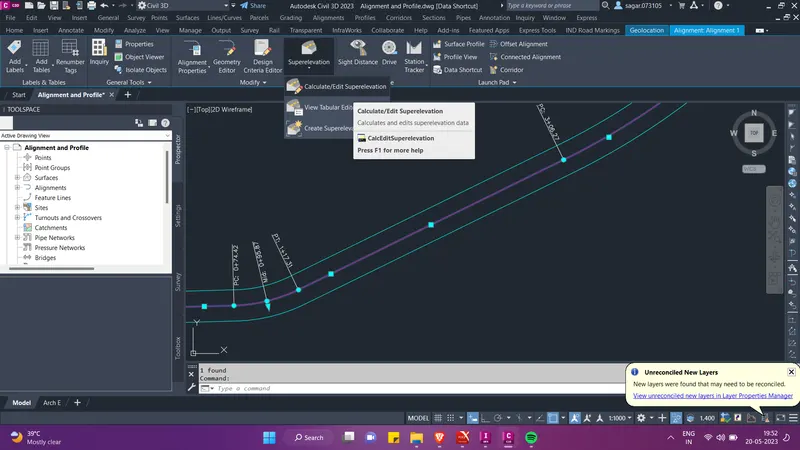
- Then provide the lane width, camber slope, shoulder width and shoulder slope. Then follow the steps as shown below.
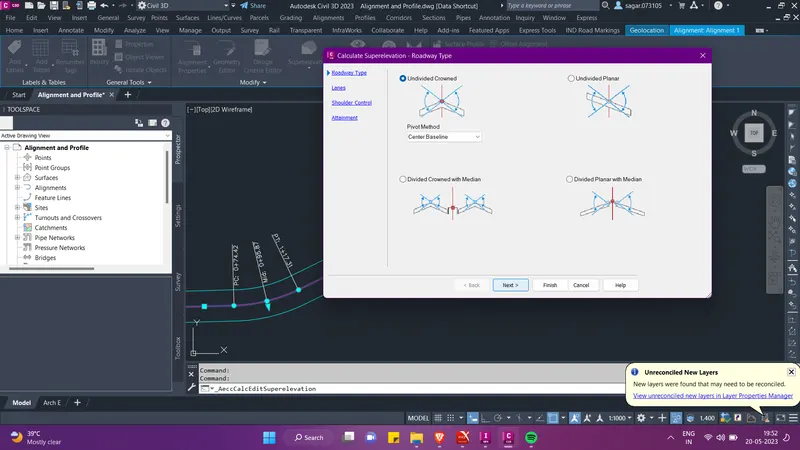
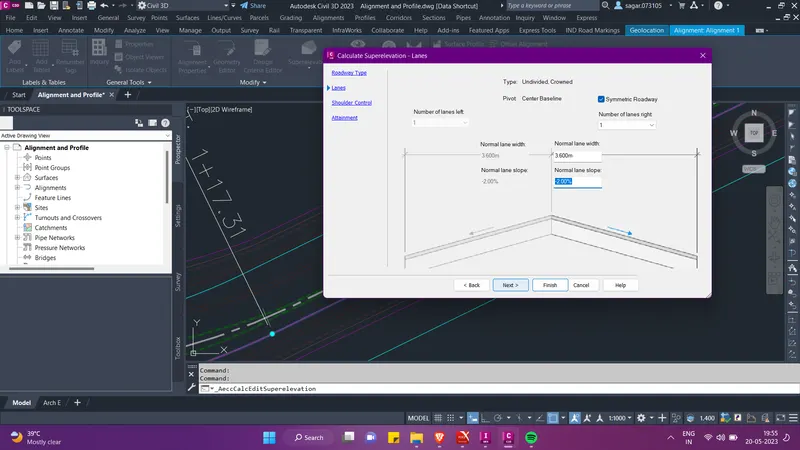
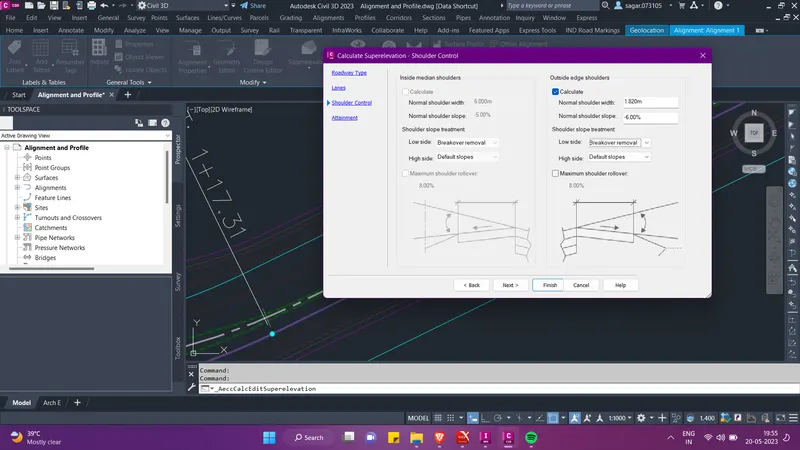
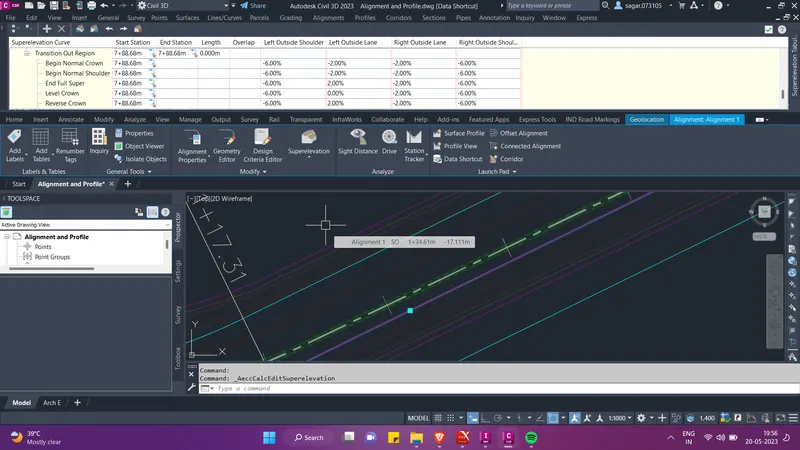
Hence the desired superelevation has been provided to the centerline alignment.
Answer 4: Vertical profile design
- After creating the alignment, go to profile option under create design palette in the ribbion to create the surface profile first. Further we will draw the design profile.
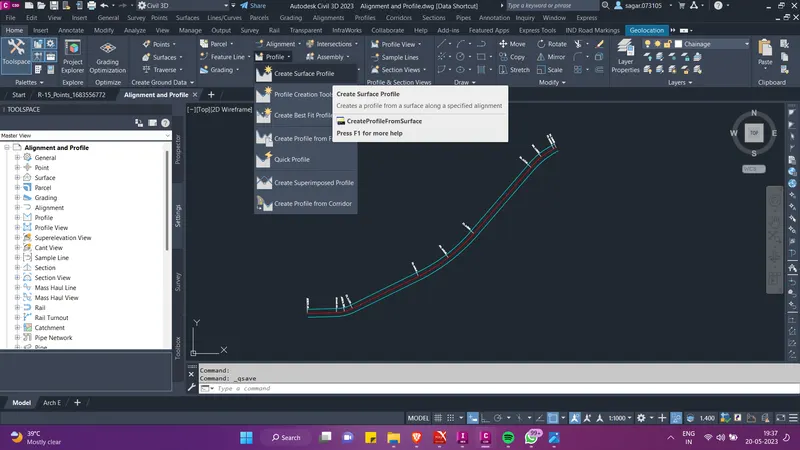
- In the pop-up menu select the existing surface and click on add. Then click on "Draw in profile view".
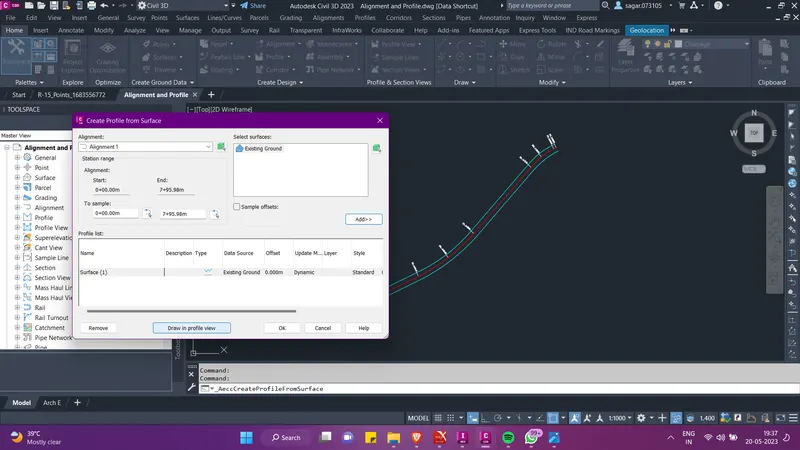
- Then select the alignment, set the prifile view style and click o Next. Follow the steps as shown below.
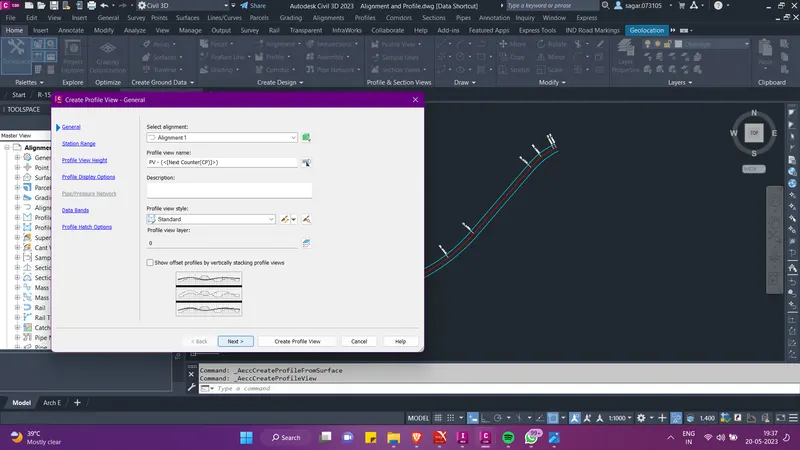
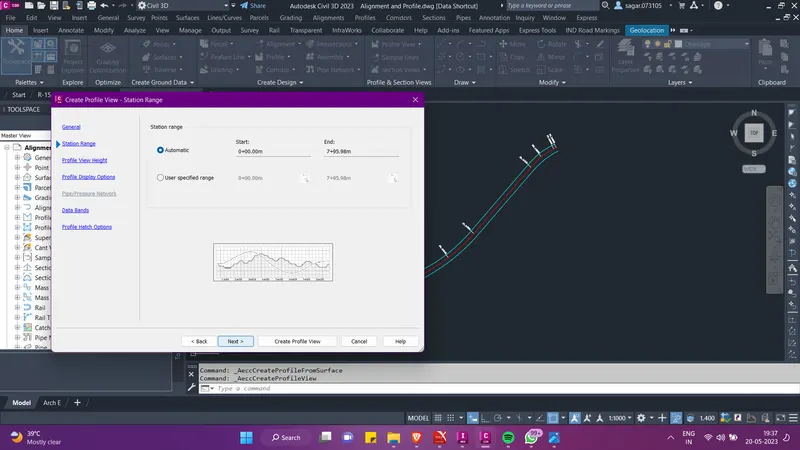
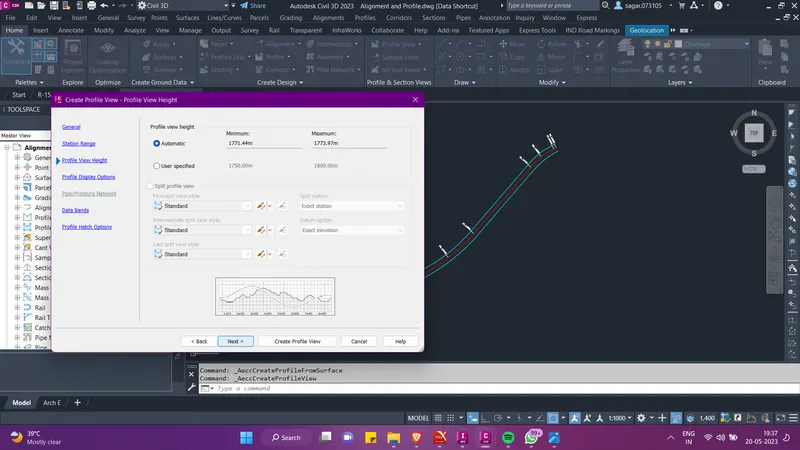
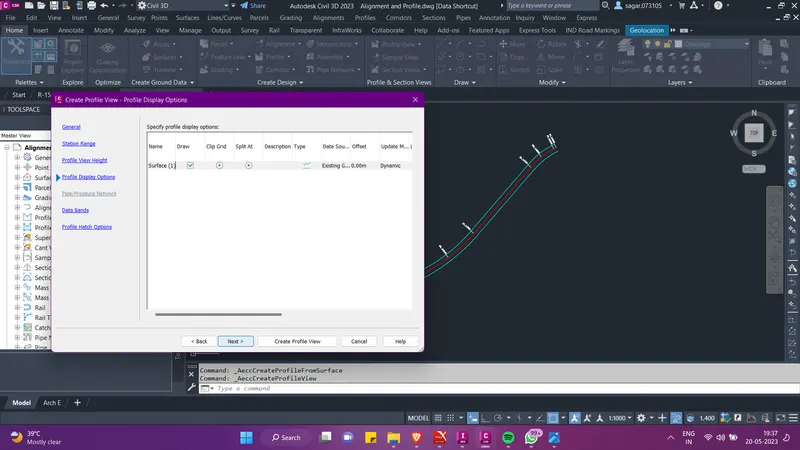
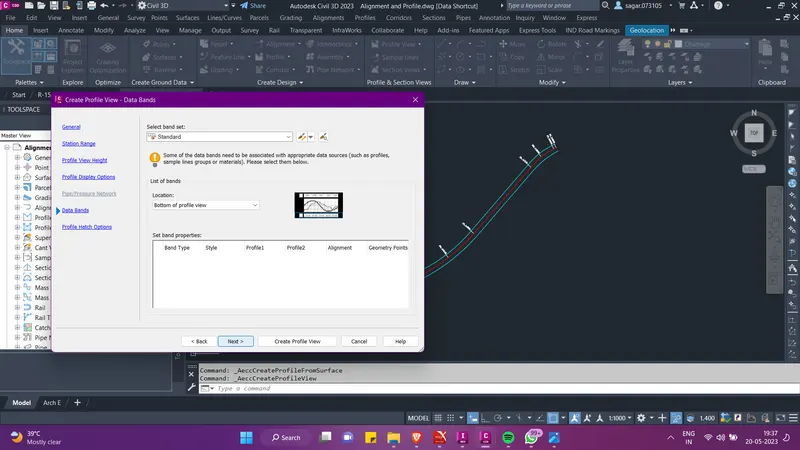
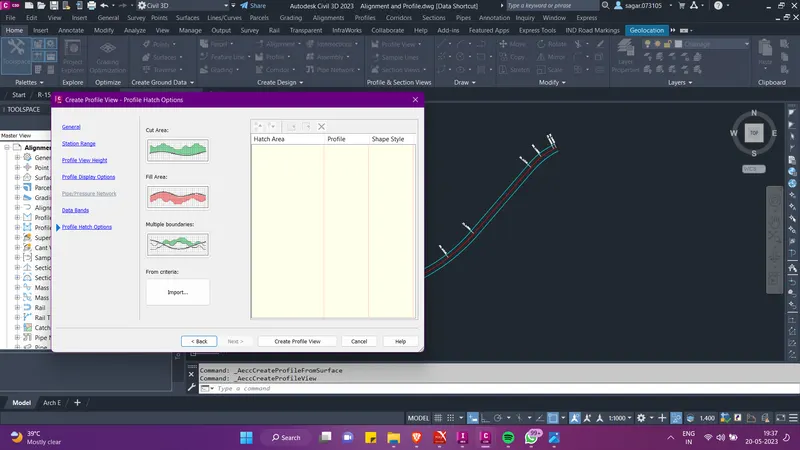
- After clicking on create profile view, click in the model space to draw the profile view for surface. Now again click on the profile option in the ribbion and select profile creation tools. A tool palette will appear.
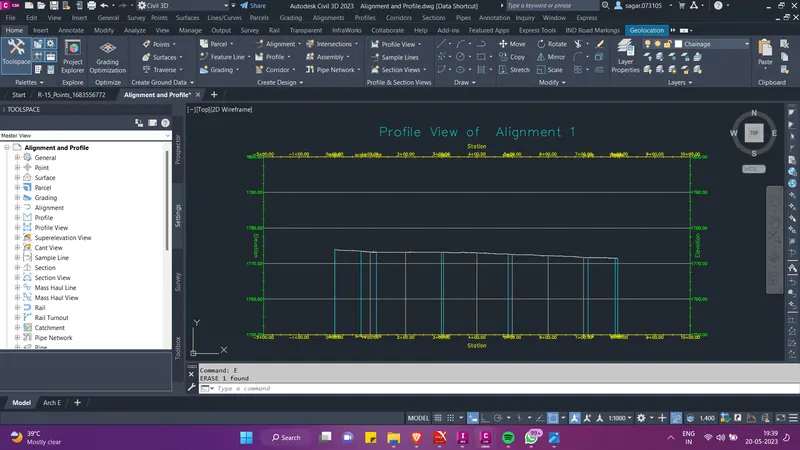
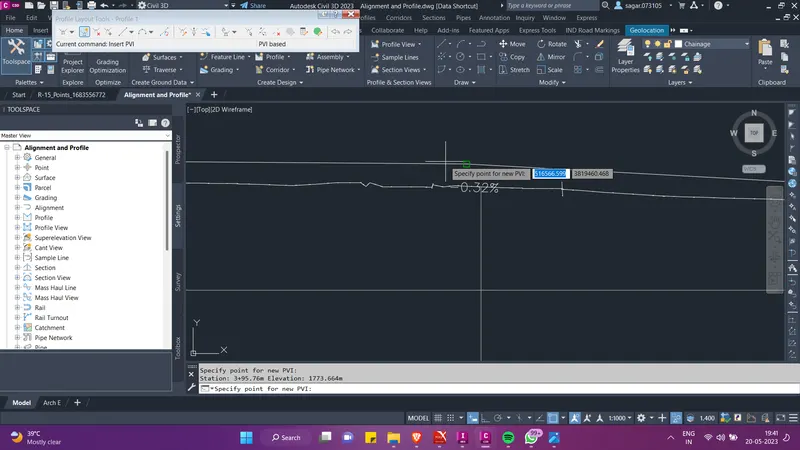
- Select tangent option from the tool palette and draw a tangent from the start to the end of the surface profile. Then select the PI option and add a PI such that the design profile is sufficiently above the existing ground profile.
- Then select free vertical curve (parabola) from the option as shown in the image below. Then select the 2 tangents press enter and provide the curve radius. Then click on OK.
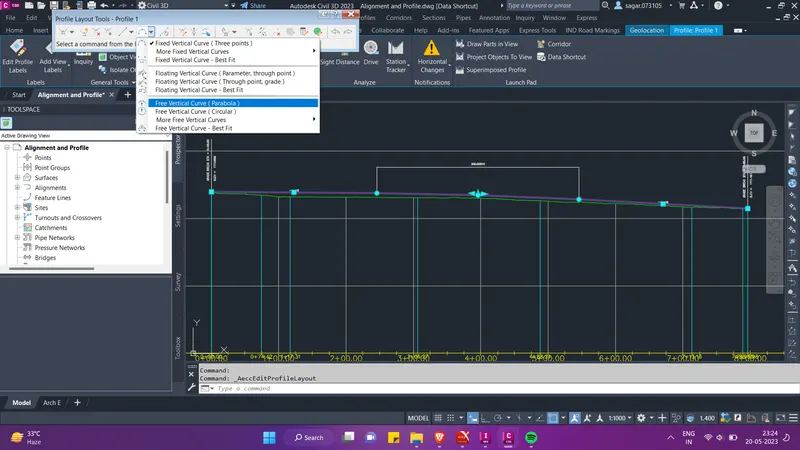
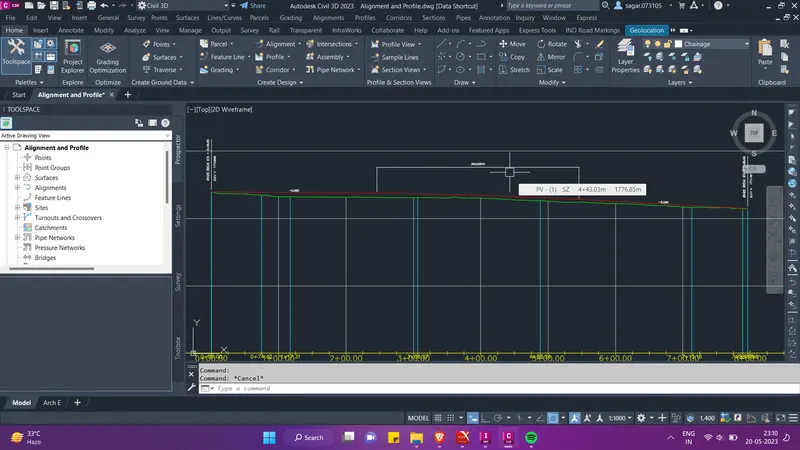
- Hence the anligment and profile view is created. Then we will create data shortcut of this file and we will use it in creating the corridor.
Answer 6 & 7: Cross section template creation based on proposed conditions and corridor modelling
- So for creating the corridor we first need to create the assemblies and sub assemblies.
- So for creating the assembly, click on the assembly option under create design palette in the ribbion and click on create assembly.
- The create assembly dialogue box will appear. Here give the name of the assembly, click OK and place the created assembly on the screen.
- Then select the assembly and from the contextual ribbion select the tool palette option. From here we can provide the sub-assemblies like lanes, shoulder, daylight conditions etc. Then as we select and place the sub-assembly a property dialogue box will also appear. Here we can change the properties of the sub-assembly like lane width, pavement layer thickness, cross slope etc. So set the desired properties and place the sub-assemblies. The created assembly will look like this.
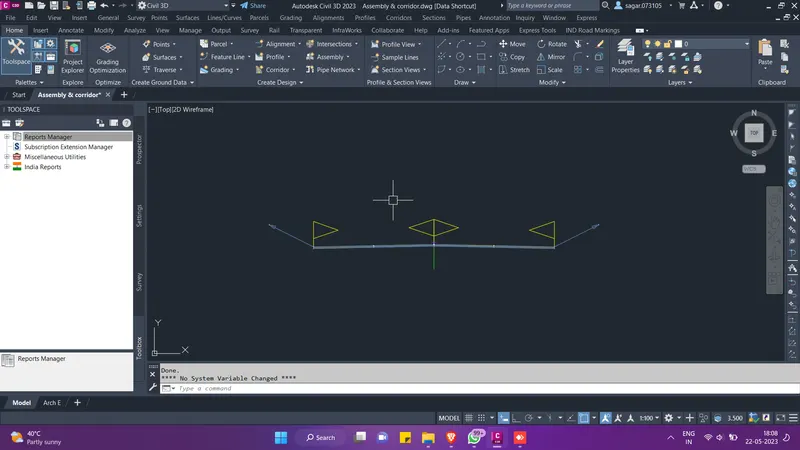
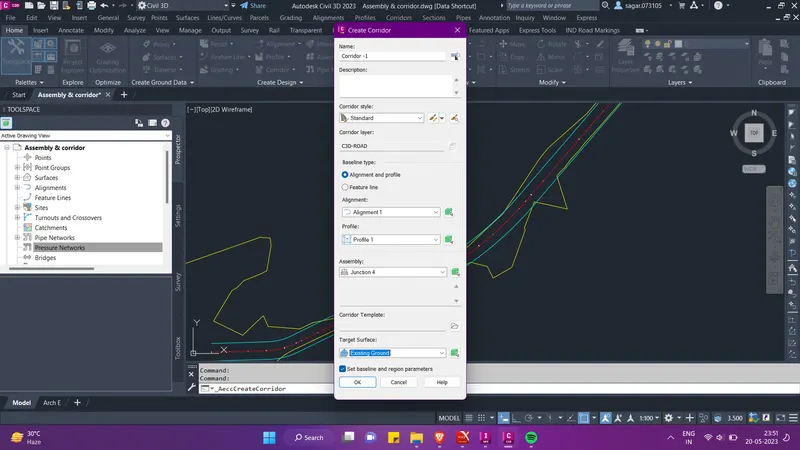
- Now we will again go to the ribbion and under create design palette select the corridor option. Then apop-up menu will appear. Here we will select the desired alignment and profile for which we are creating the corridor. We will also set the target surface and the assembly the we created above.
- Then the baseline will be created for the selected alignment and the assembly will also be added as a region. Now for both the baseline and region we will set the surface target. For this, under the target column in the same menu click on three dots, and from the pop-up menu go to the surface tab and there set the surface as existing ground.
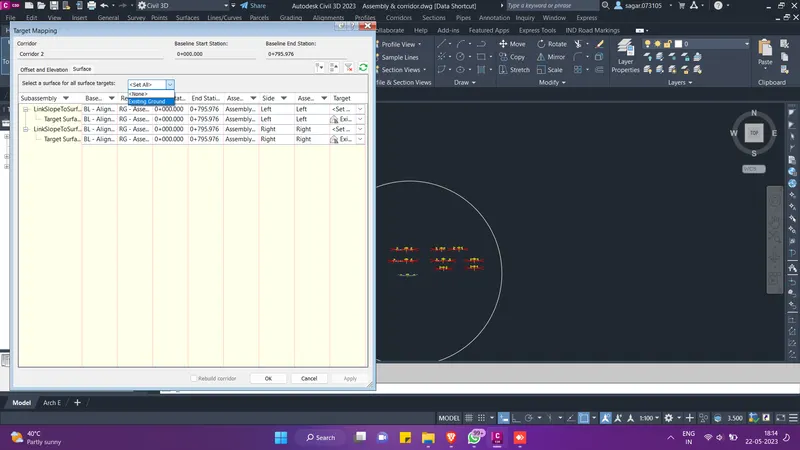
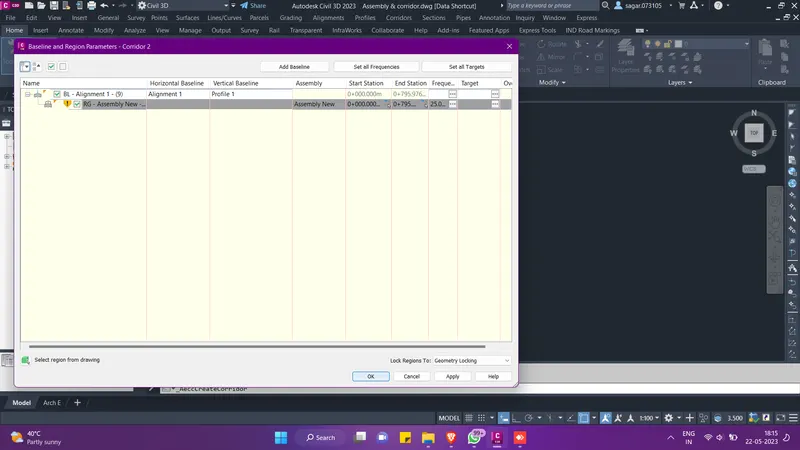
- Then click on OK to create the corridor. Then after the corridor creation we will add sample to the created corridor to generate cross-sections. For this, go to sections option in the ribbion and select create sample lines.
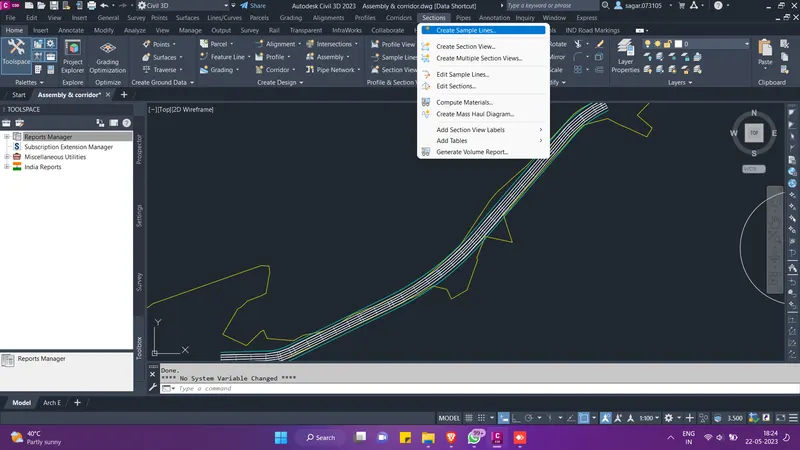
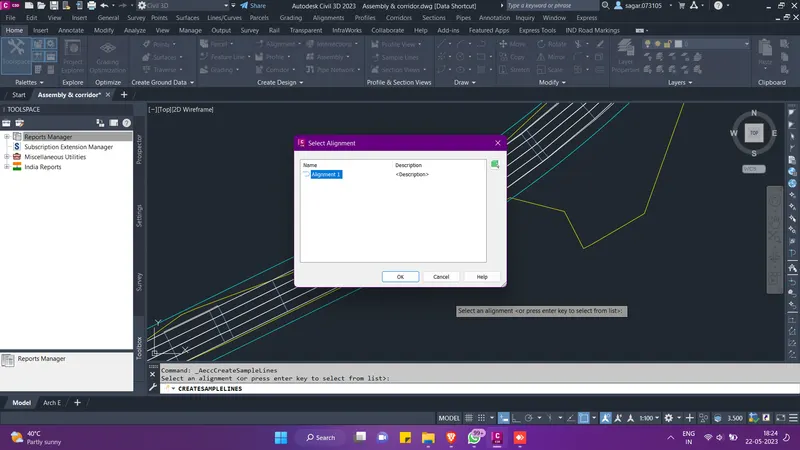
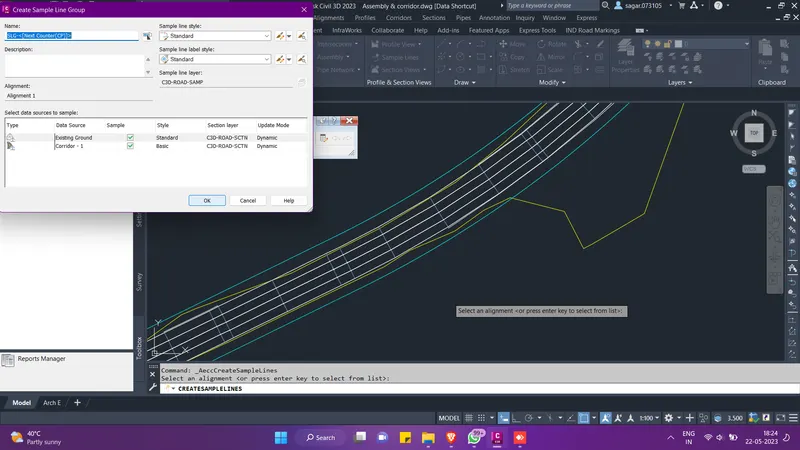
- Then press enter and select the desired alignment. The from the pop-up menu give the name for the sample line group and then click on OK.
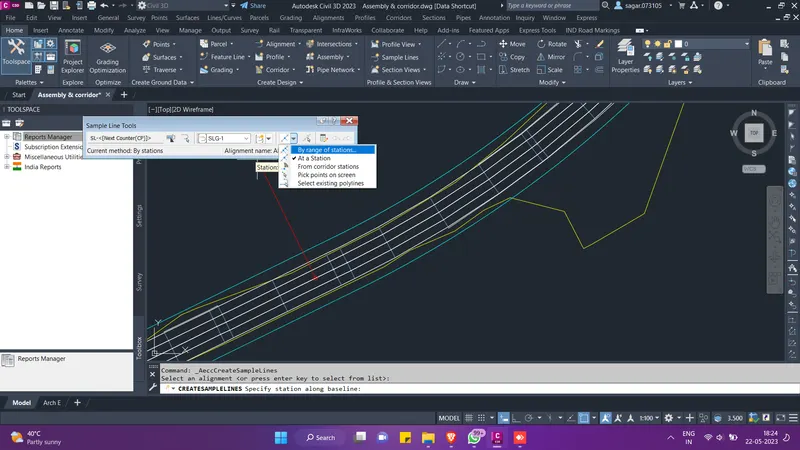
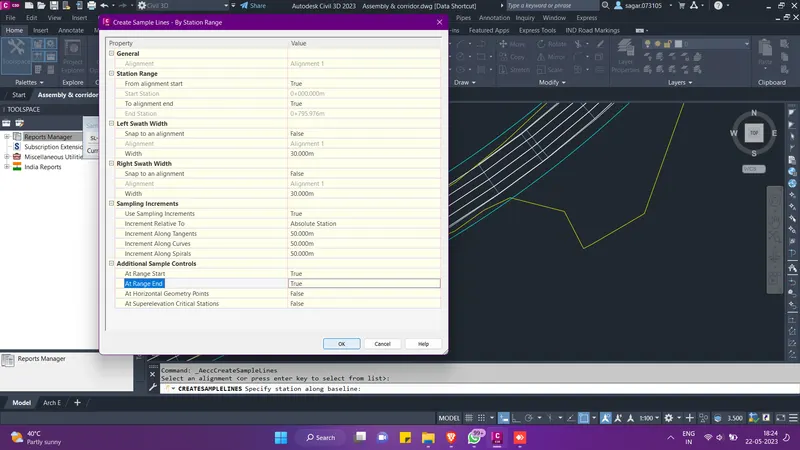
- Then a tool palette will appear. Here from the option as shown below select sample lines by range of stations. Then another menu will appear, here set the start and end range as true and click on OK. Then the sample lines will be created.
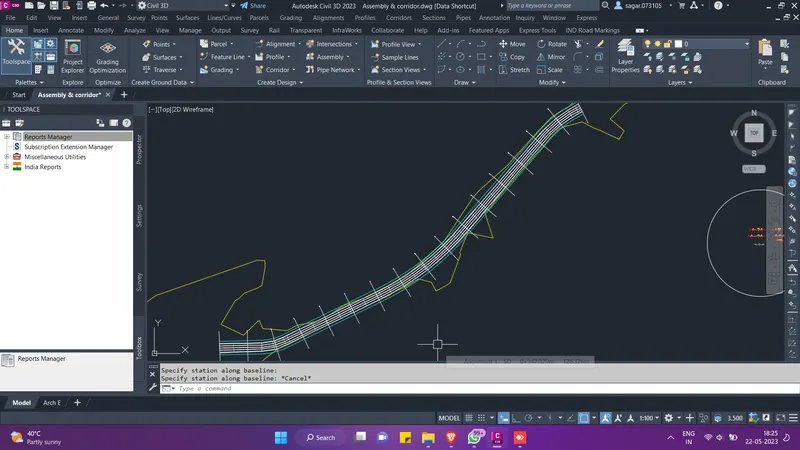
- Now we will compute the quantities. So for this we first need to compute material list. So for this go to the compute material option under sections tab in the menu bar. Then from the pop-up menu click on add new material and then define the material.
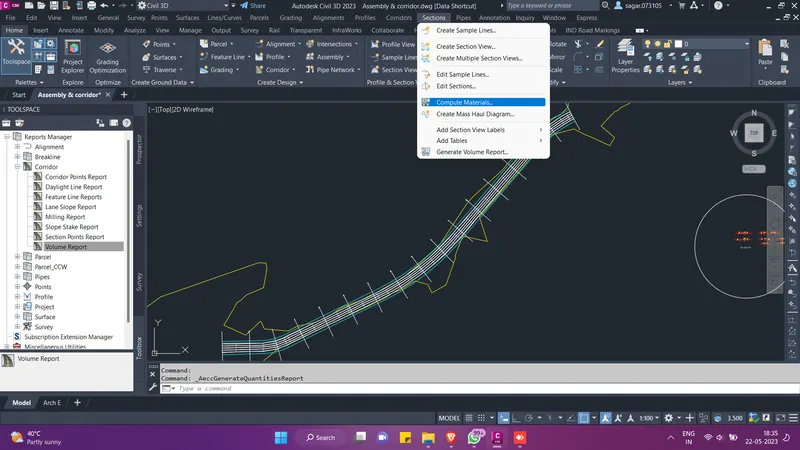
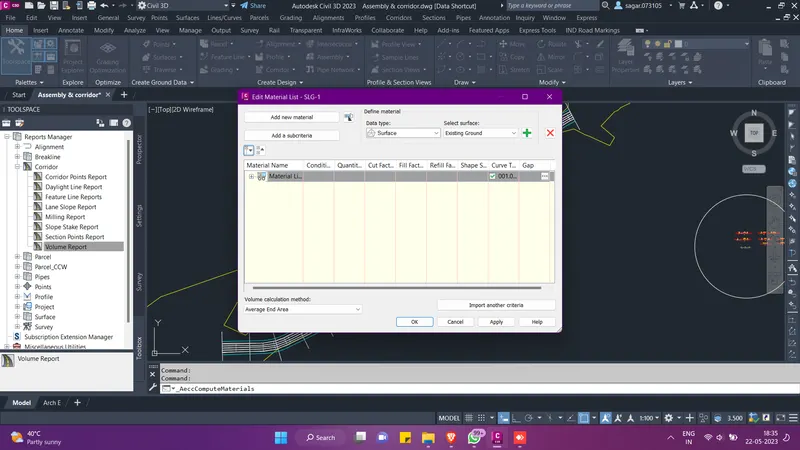
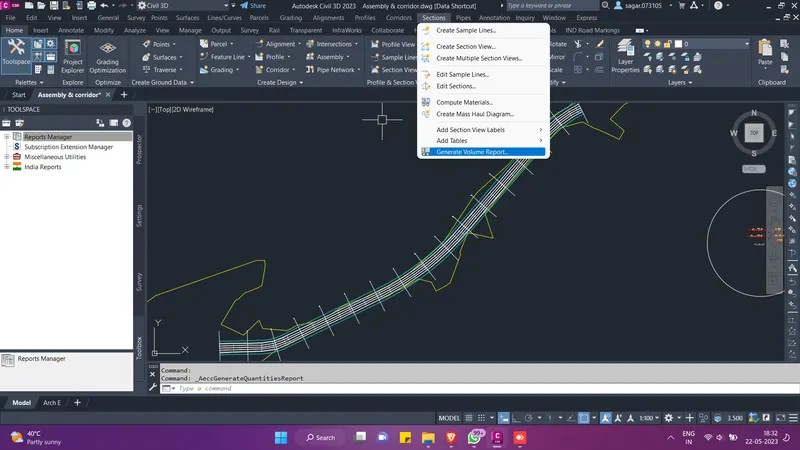
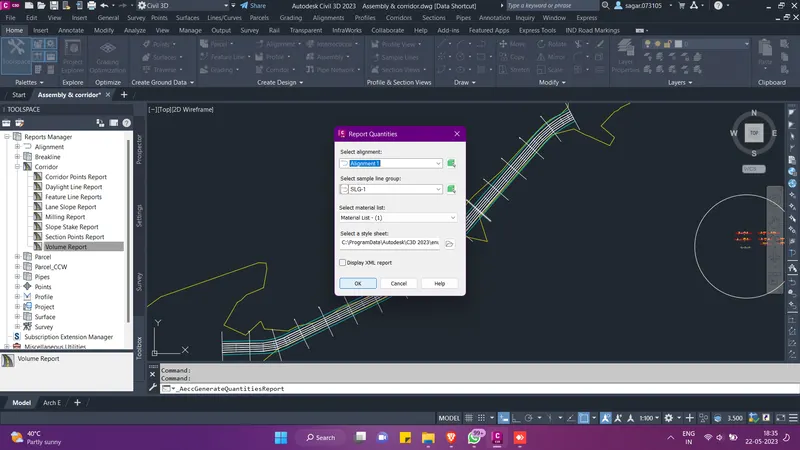
- Then click on apply and OK. Then again go to sections tab in the menu bar and click on generate volume report. Then from the pop-up menu as shown below select the sample line group and the alignment and the material list and then click on OK. then the quantity report will be generated.