Project
SYSTEM-LEVEL SIMULATION OF AN ALL-TERRAIN VEHICLE
- Carry out a system-level simulation of an all-terrain vehicle.
Download the model from the given link:
https://www.mathworks.com/matlabcentral/fileexchange/70576-baja-all-terrain-vehicle-atv-model
Prepare a technical report explaining the model properties & comments on the results.
Aim
To prepare a technical report on the Simulation of BAJA All-Terrain Vehicle (ATV) under different conditions and explain the results.
Objective
- To carry out a Simulation of an All-Terrain Vehicle (ATV).
- To prepare a technical report explaining the model properties & comment on the results.
Theory
All-Terrain Vehicle (ATV):
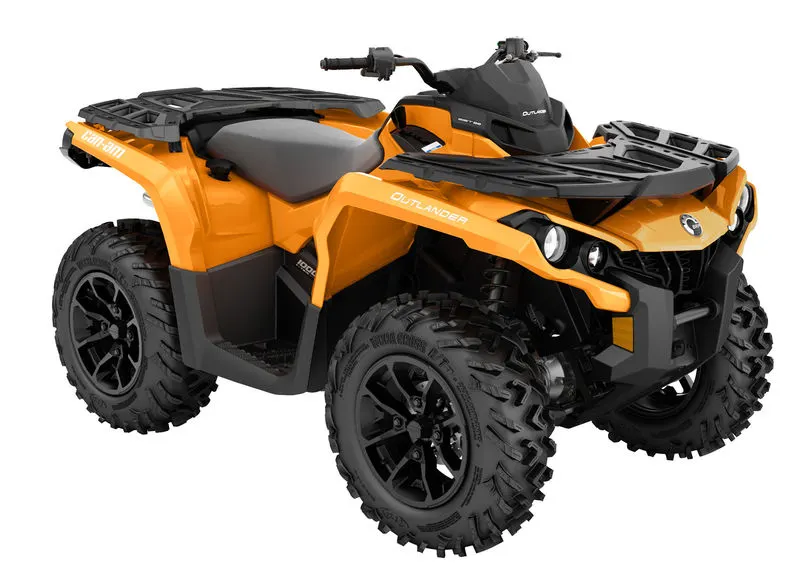
An All-Terrain Vehicle (ATV), also known as a light utility vehicle (LUV), a quad bike, or simply a quad. It is a vehicle that travels on low-pressure tires and has a seat that is straddled by the operator along with handlebars for steering control. It is designed to handle a wider variety of terrain than most other vehicles. ATVs come in many different shapes and sizes. The different types of ATVs are designed and manufactured for different uses including racing, pit vehicles, reaction, hunting, ranching, military, emergency services, and industrial usage.
Continuously Variable Transmission (CVT):
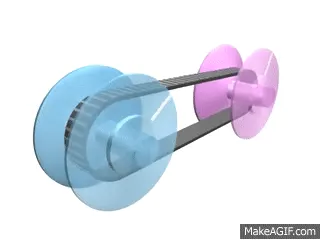
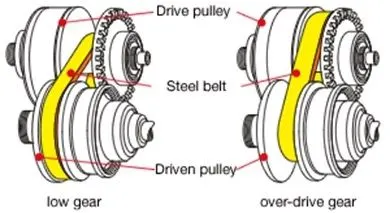
A continuously variable transmission (CVT), also known as a shiftless transmission, step-less transmission, and pulley transmission is an automatic transmission that can change seamlessly through a continuous range of effective gear ratios. The CVT does not strictly require the presence of a clutch. Nevertheless, in some cases, a centrifugal clutch is added to facilitate a “neutral” stance, which is useful when idling or manually reversing. A belt-driven design offers approximately 88% efficiency.
Procedure
- First, we use a signal builder block to input values.
- The corresponding values of distance and force are assigned inside the repeating sequence block.
- A scope is connected to observing the graph.
- Now from the graph work done can be calculated by finding the area under the curve.
- To calculate the area under the curve, we use the integrator block.
- To observe the work done, we connect a display block.
Simulink Model
Basic blocks used:
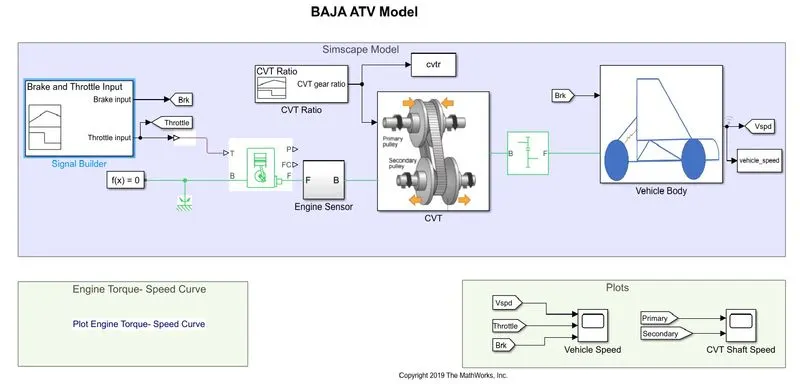
- Signal builder: The signal builder block allows you to create interchangeable groups of piecewise linear signal sources and use them in a model. It can quickly switch the signal groups into and out of a mode to facilitate testing. In this model, there are two inputs named Brake and Throttle input.
- Generic Engine: Represents a system-level model of spark-ignition and diesel engines suitable for use at the initial stages of modelling when only the basic parameters are available. Optional idle speed and red line controllers are included.
The throttle input signal T lies between zero and one and specifies the torque demanded from the engine as a fraction of the maximum possible torque. If the engine speed falls below the stall speed, the engine torque is blended to zero. If the engine speed exceeds the maximum speed, the simulation stops and issues an error message.
Connections F and B are mechanical conserving ports associated with the engine crankshaft and engine block, respectively. Connections P and FC are physical signal output ports through which engine power and fuel consumption rate are reported.
- Engine sensor: This sensor is connected to a Generic Engine. It consists of:
- Physical Modeling Connection Port block for subsystems.
- The ideal Mechanical Rotational Sensor block measures angular velocity or angle in a mechanical rotational network. The sensor is ideal since it does not account for inertia, friction, delays, energy consumption & so on.
- PS Terminator block is used to terminate physical signal outputs. Unconnected physical signal output ports do not generate warnings, but a connection to a PS Terminator can be used to indicate that the signal was not inadvertently left unconnected.
- This sensor is further connected with a CVT Subsystem.
- CVT Subsystem:
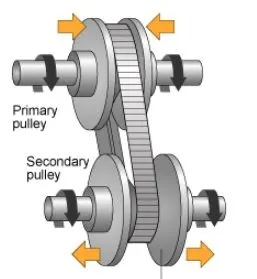
The CVT mainly consists of
- Primary pulley
- Variator
- Secondary pulley
- Belt
Conditions:
- If the primary pulley moves inward while the secondary pulley moves outwards then it will lead to overdrive (RP > RB).
- If the primary pulley moves outward and the secondary pulley moves inward then it will lead to Speed Reduction (RP < RB).
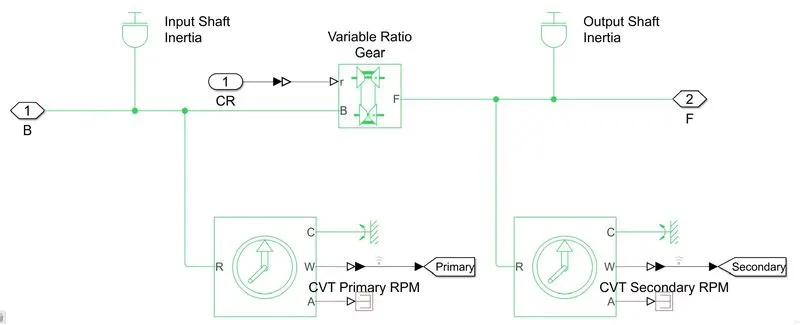
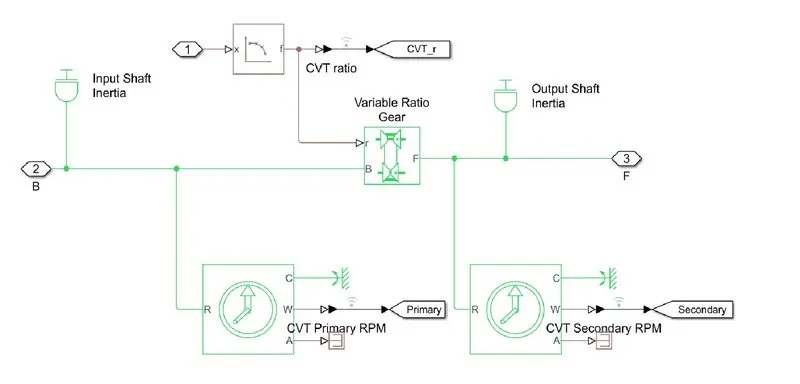
This CVT Subsystem consists of various blocks such as Input & Output Shaft Inertia, Variable Gear Transmission, Ideal Rotational Motion Sensors, and PS Terminator along with Mechanical Rotational Reference.
- Simple Gear: Represents a fixed-ratio gear or gearbox. No inertia or compliance is modeled in this block. It includes gear meshing, backlash, and viscous bearing losses. Connections B (base) is connected to the CVT subsystem while Connection F (follower) is connected to the Vehicle Body. The connections are mechanical rotational conserving ports that specify the relation between base and follower rotation directions with the Output shaft rotates parameter.
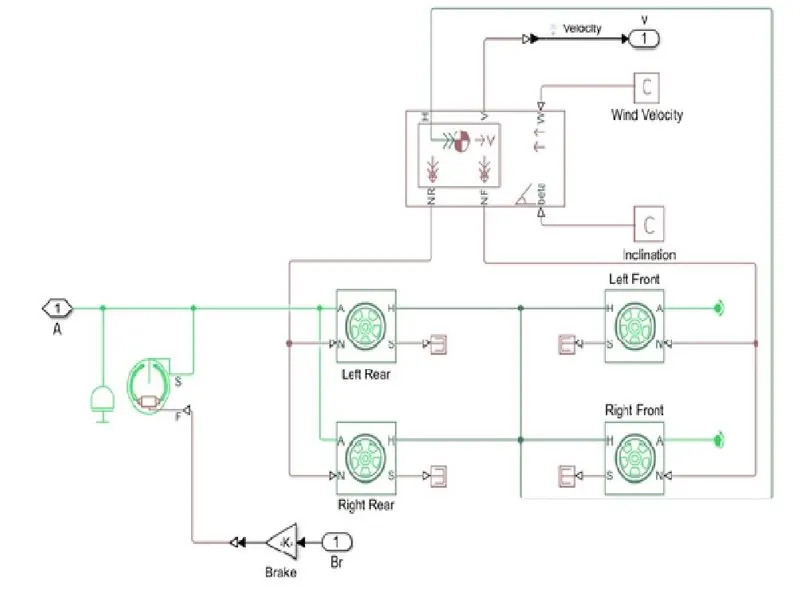
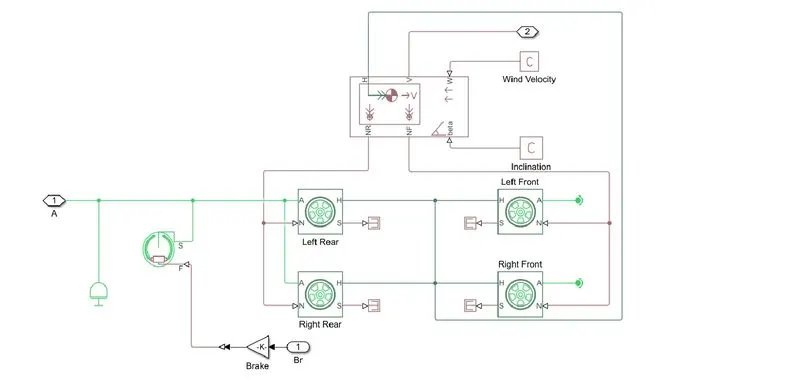
- Vehicle body: Represents a two-axle vehicle body in longitudinal motion. The block accounts for body mass, aerodynamic drag, road incline, and weight distribution between axles due to acceleration and road profile. The vehicle can have the same or a different number of wheels on each axle. Optionally include pitch and suspension dynamics or additional variable mass and inertia. The vehicle does not move vertically relative to the ground.
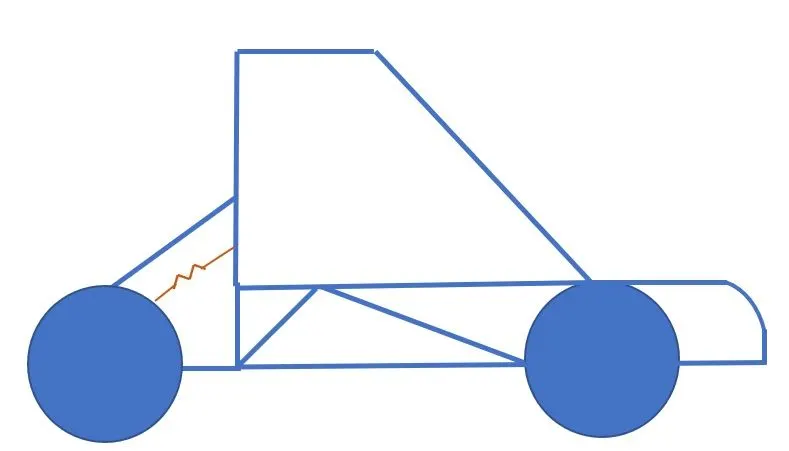
It consists of four wheels, two wheels at the rear and the other at the front. The rear wheel is connected with a Double Shoe Brake which represents a brake arranged as two pivoted rigid shoes symmetrically installed inside or outside a drum and operated by one actuator. The actuator force causes the shoes to exert friction torque on a shaft connected to the drum.
- Go To
- Simulink-PS Convertor
- Solver configuration: It is a type block that acts as a complete equation for where f(x)=0, where we find the value of x and generate the output which represents the block diagram as an equation.
- Mechanical Rotational Reference
- Simple Gear
- Chart
- From
- Scope: To view the characteristics of a property with respect to the time
The model taken for the study is the BAJA ATV model with Continuously Variable Transmission (CVT)
Here we need to do the following study:
- BAJA ATV model without dashboard
- BAJA ATV model with dashboard
- BAJA ATV model using the lookup table without a dashboard
- BAJA ATV model using the lookup table with a dashboard
Study 1: BAJA ATV model without dashboard
The study based on the BAJA ATV model with CVT consists of a signal builder with throttle and brake input for a driver, generic engine, motion sensors, simple gear, vehicle transmission, vehicle body with the tire, and solver configuration blocks as shown in the figure below.
Model:
CVT Model
Vehicle Body Model
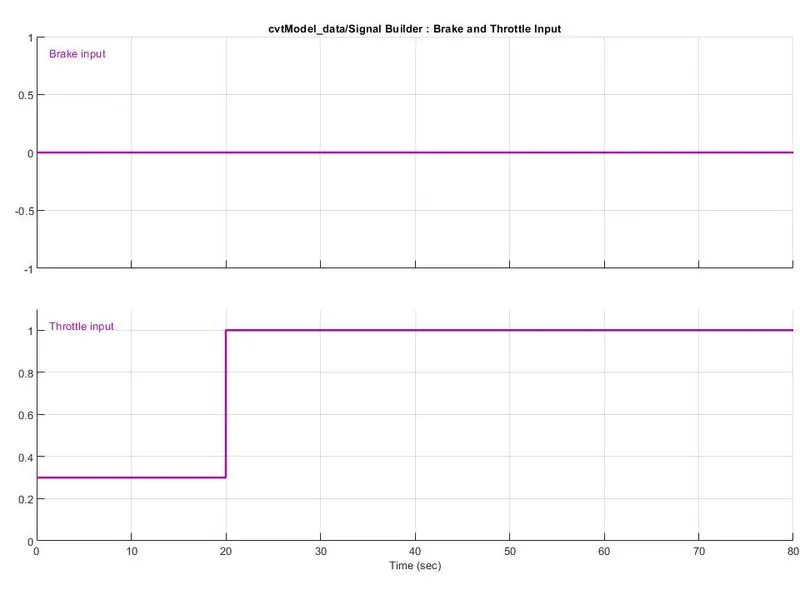
Signal Builder
- Brake input is constant i.e., zero throughout the given sample time which is 80 seconds.
- Throttle input is 0.5 for 20 seconds, later it increases to 1 for the remaining time till 80 seconds.
Engine Torque-Speed Curve
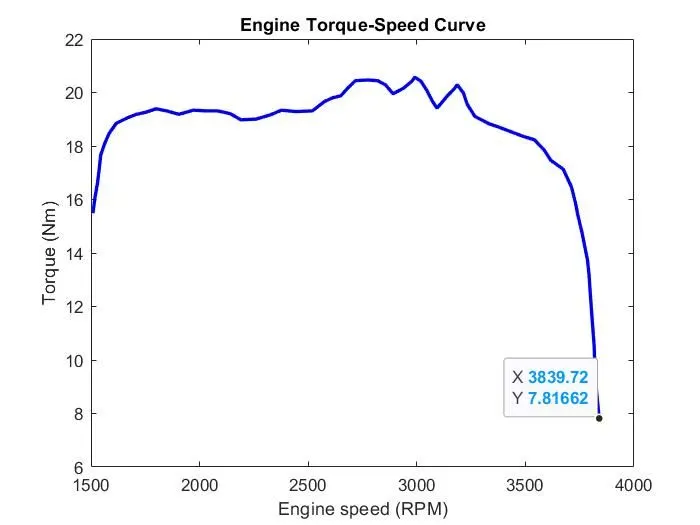
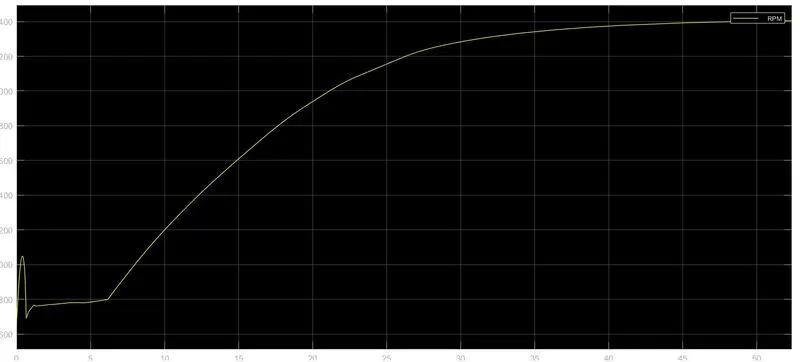
Vehicle Speed depends on CVT Ratio. The data is extracted using the GRABIT command which is available in the workspace. From the above graph, we have got the Maximum Velocity which is 3839.72 RPM.
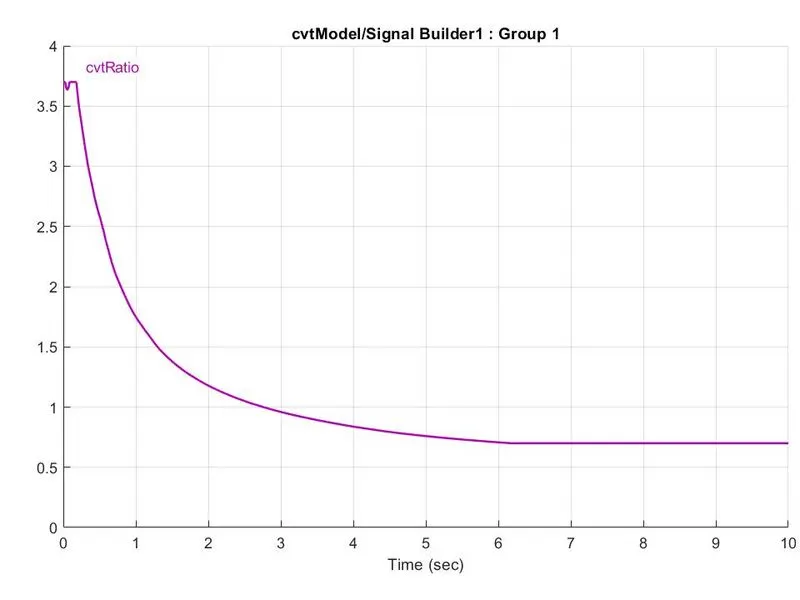
CVT Ratio
CVT Gear Ratio
RESULTS:
Engine Speed
Vehicle Speed
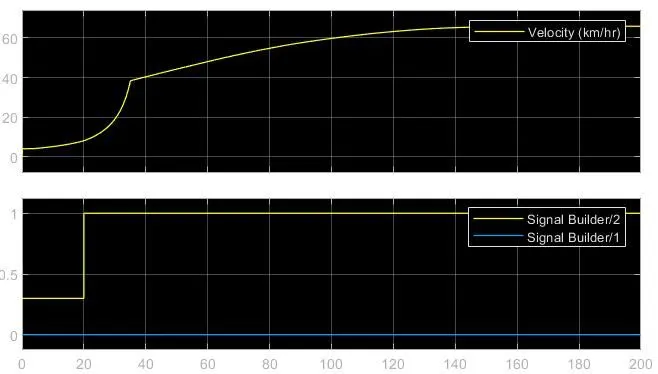
While providing Throttle input, we observed if the value 0.3 is considered then the velocity shows a sudden drop in the speed hence, we changed it to 0.5 to get the smooth flow of velocity.
CVT Shaft Speed
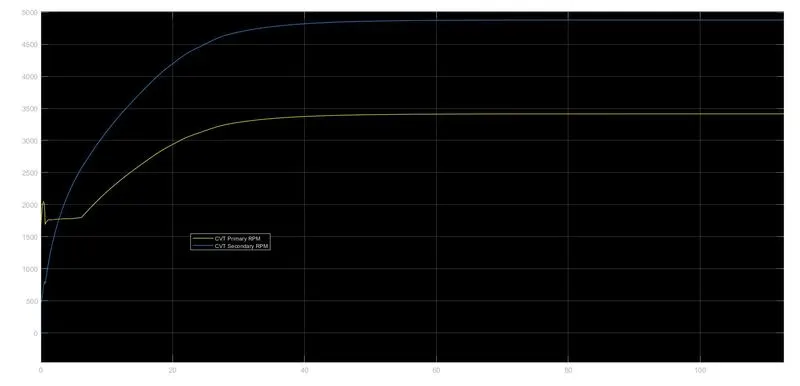
The CVT shows variations with respect to primary and secondary RMP based on their Gear Ratio.
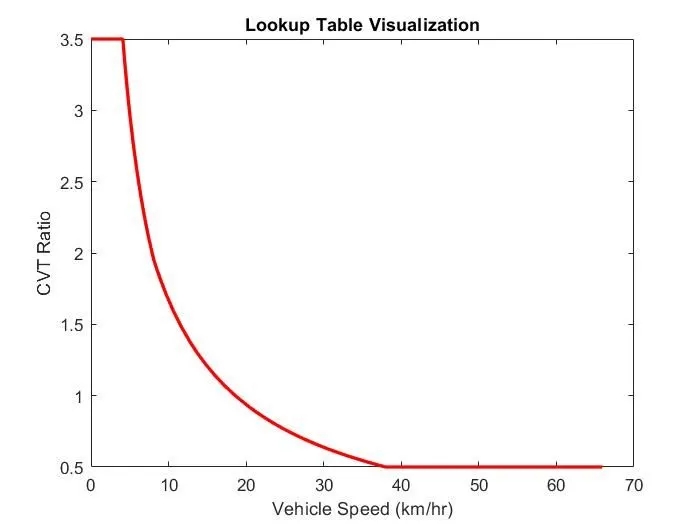
Lookup table
Explanation:
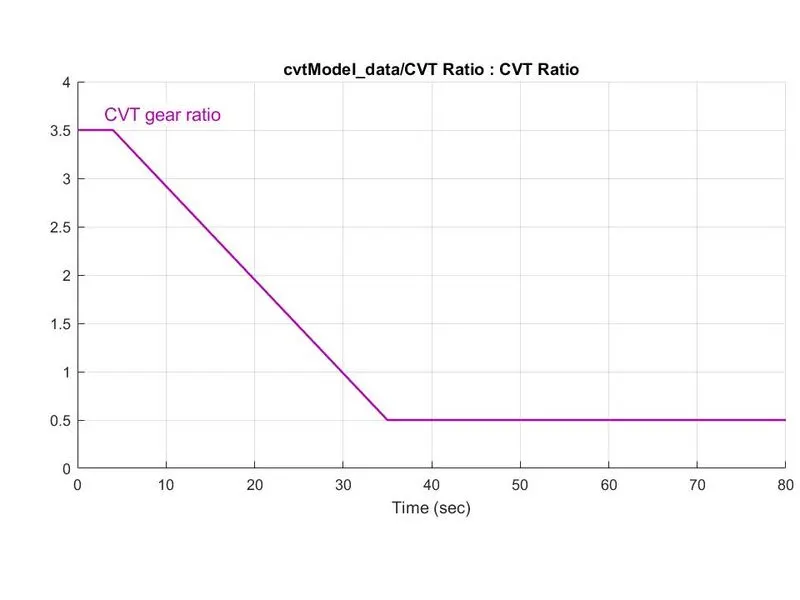
The input is provided using the signal builder for brake, throttle, and gear ratio.
Here, the value for the brake is taken as zero for the entire simulation, the throttle value is given as 0.3 to 20 sec, and the value increases to 1 for the overall simulation i.e., 80sec.
As we know that as the throttle increases then the power increases by excess input of fuel into the system and shows in the output also growing.
The value of the gear ratio is maintained as 3.5 for the first 5 sec and then decreases to less than 0.5 up to 38sec and then linearly so after with a constant value.
STUDY 2: All-Terrain Vehicle (ATV) with CVT and Dashboard
Model:
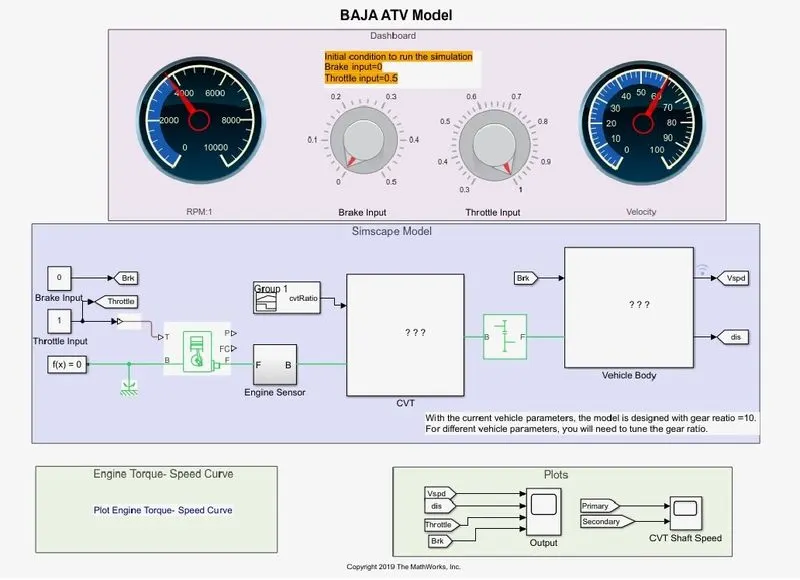
- This model is similar to that of the previous one, the one extra that is added over here is Dashboard which has Brake and Throttle Input knobs that allows the user to change the input values while the simulation is running.
- We kept the brake input as zero whereas the throttle keeps on changing based on the input by the user.
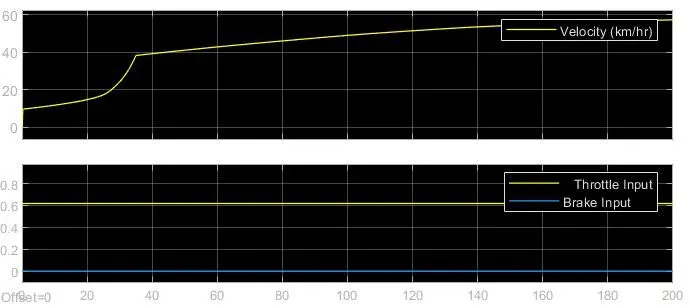
- The change in throttle inputs results in the changes in the vehicle speed which varies simultaneously with it.
Result:
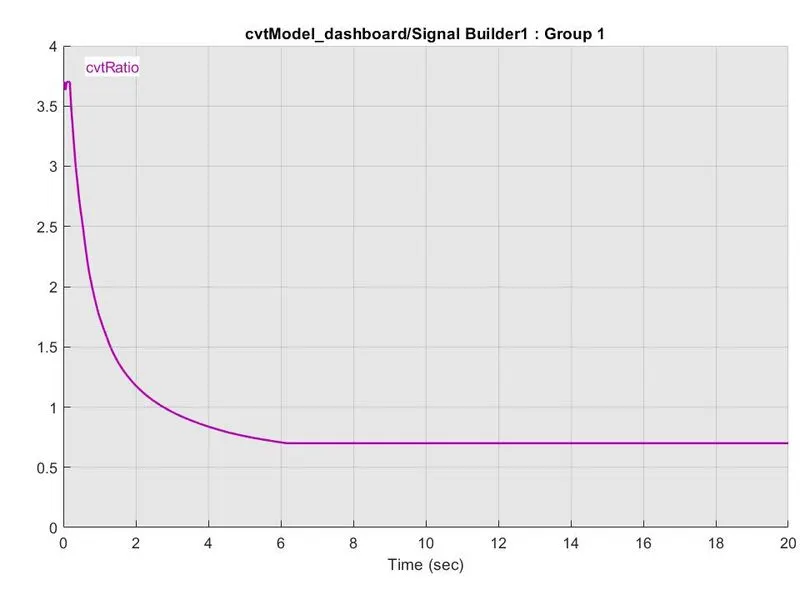
CVT
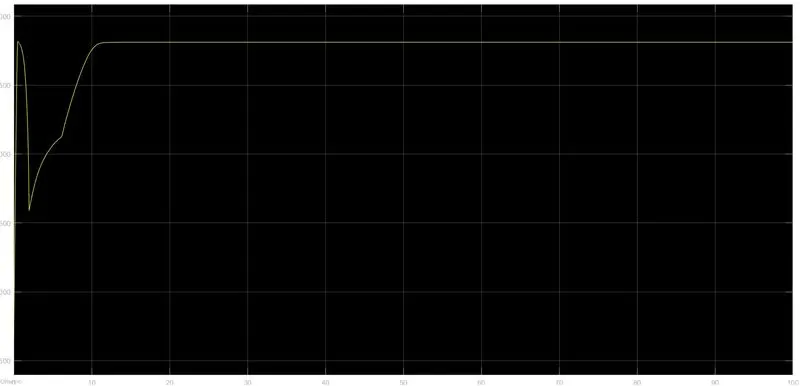
Engine Speed
Vehicle Speed
CVT Shaft Speed
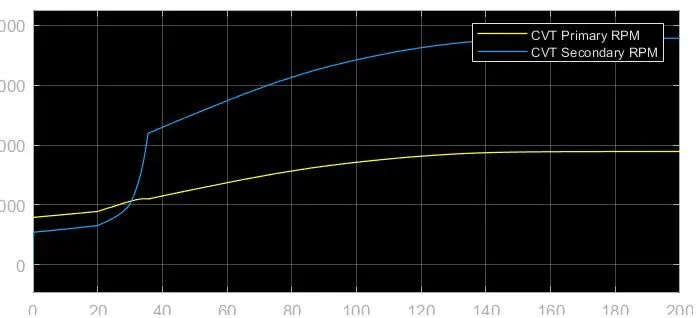
The CVT shows variations with respect to primary and secondary RMP based on their Gear Ratio.
Explanation:
The main intention behind the usage of the dashboard is to study the output value with the variation in the input values of throttle and brake, which will give the value of rpm and velocity of the engine in the digital reading.
As we know that as throttle increases then the power increases by excess input of fuel into the system and shows in the output also increasing and vice-versa.
STUDY 3: All-Terrain Vehicle (ATV) with CVT using Lookup Table
Model:
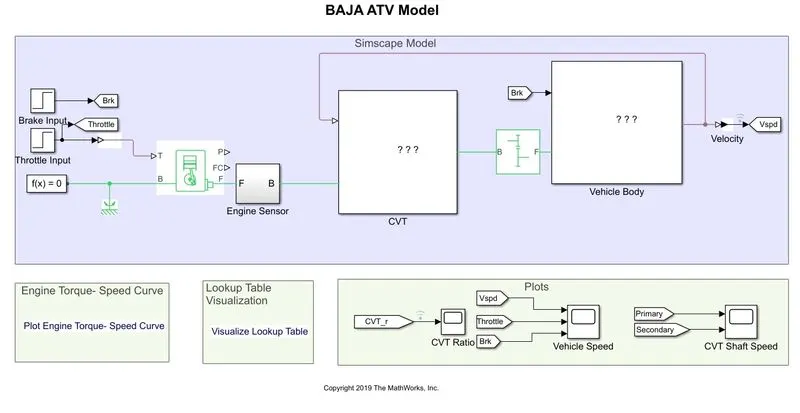
Blocks included in the above Simulink model of BAJA ATV with CVT:
- Step time
- Generic engine
- Motion sensors
- Vehicle transmission
- Vehicle body
- Tires
- Solver configuration
The CVT system includes a look-up table, an array of data that maps input values to output values, thereby approximating a mathematical function. If we give an input set of values, the look-up operation retrieves the corresponding output values from the tables. If the look-up table does not explicitly define the input values, then Simulink can estimate the output value using interpolation, extrapolation, or rounding.
- Interpolation: It is the process of estimating values that lie between known data points.
- Extrapolation: It is the process of estimating values that lie beyond the range of known data points.
- Rounding: It is the process of approximating the values by altering their digits according to a known value.
CVT Model:
Vehicle Body Model:
Engine RPM:
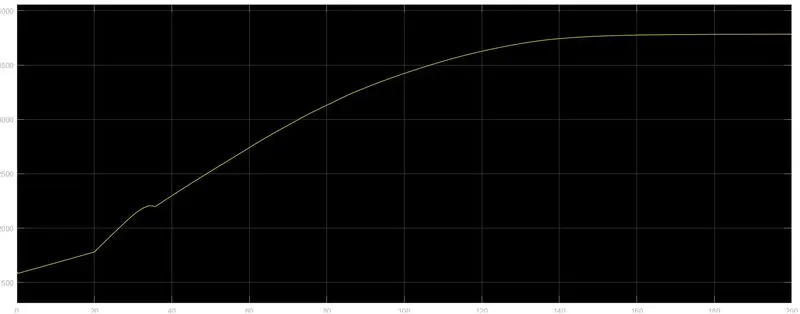
The brake and throttle input is given by step time, which depends on the run time and it varies accordingly. By using the loop-up table for the gear ratio it gives the input to the CVT part and accordingly obtains the output. This method works in a closed loop and the inputs are given with the loop-up table data. Here, the Simulink gets the input values from the look-up tables and according to the values from the input, the output is got I n terms of gear ratio.
Vehicle Speed
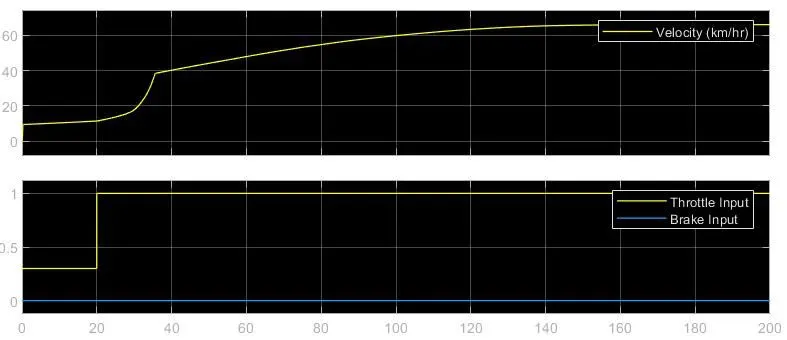
In this, the Brake input is 0 and the throttle input is 0.3 for 20 seconds. Later it changes to 1 till rest. The velocity of the vehicle shows gradual growth for the first 20 seconds later it increases from 20-40 seconds till the speed gets stable.
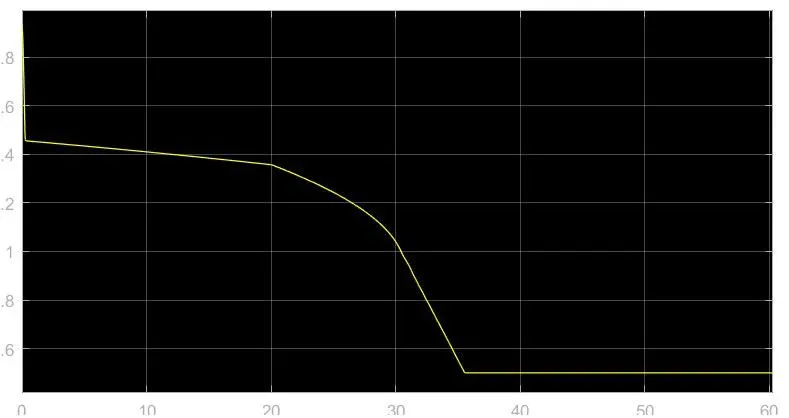
CVT Ratio
CVT Shaft Speed
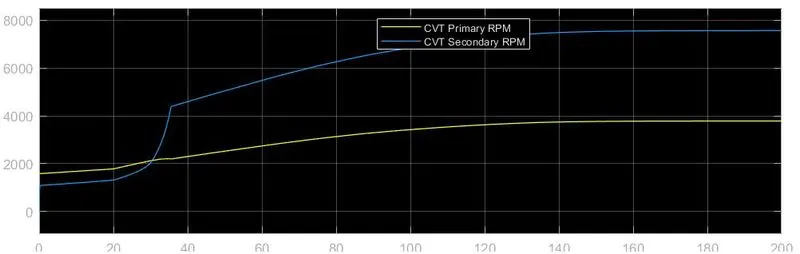
The CVT shows variation with respect to primary and secondary RMP based on their Gear ratio.
Lookup Table
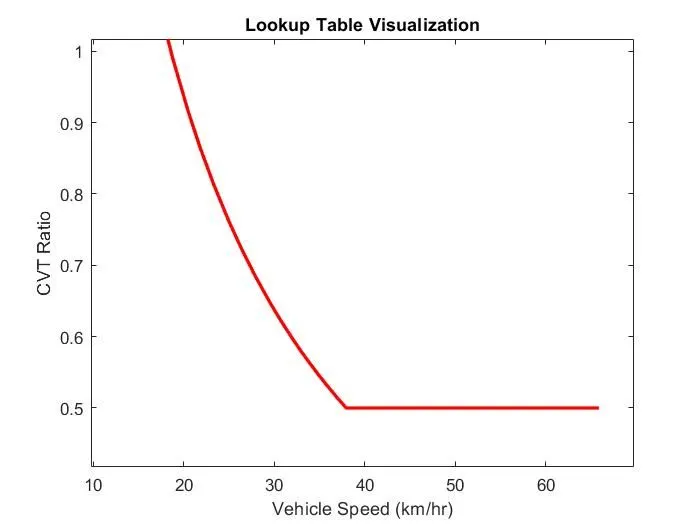
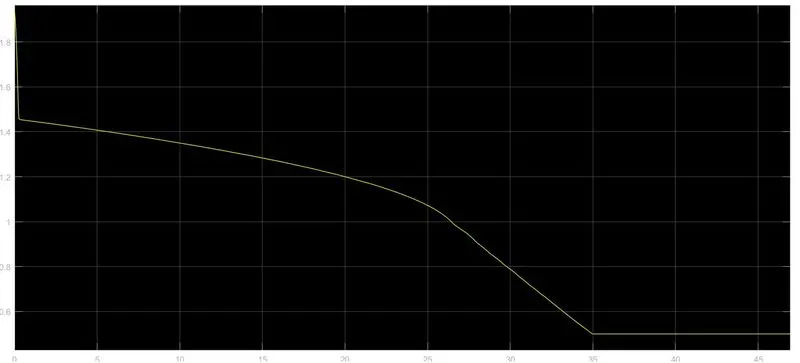
The gear ratio varies from 1 to 0.5 and the output in terms of velocity increases gradually up to 40km/hr. Then with the value of gear ratio 0.5 the velocity increases linearly to a maximum of nearly 56km/hr.
Study 4: All-Terrain Vehicle (ATV) with CVT and Dashboard using Lookup Table
Model:
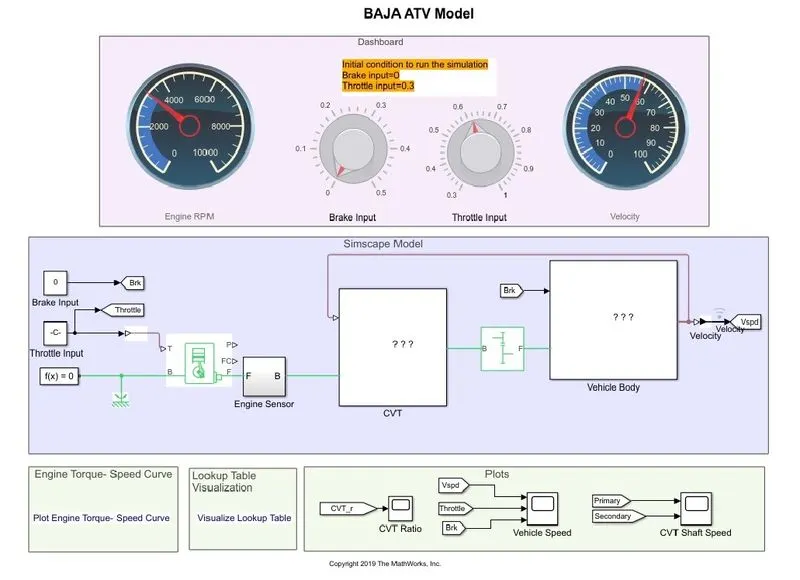
The above study is based on the BAJA ATV with the dashboard model using the look-up table which consists of throttle and brake meters in the dashboard. With the help of the dashboard, we can see the variation of the output with input values being varied.
Here, as we know the gear ratio is inputted from the look-up table and the Simulink will give the output with respect to inputted values. The gear ratio is directly proportional to the torque. As we know that as throttle increases then the power increases by excess input of fuel into the system and shows in the output also growing.
Vehicle Speed
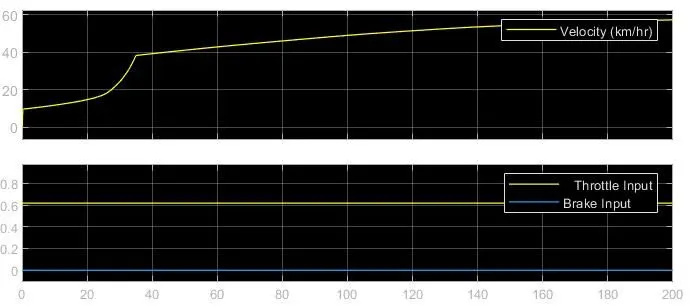
From the graph, once the throttle is increased the speed is increased, and vice-versa for the decrease in the throttle input. The brake remains zero throughout the simulation. The brake remains zero throughout the simulation. The vehicle shows similar changes with reference to the throttle input.
Engine Speed
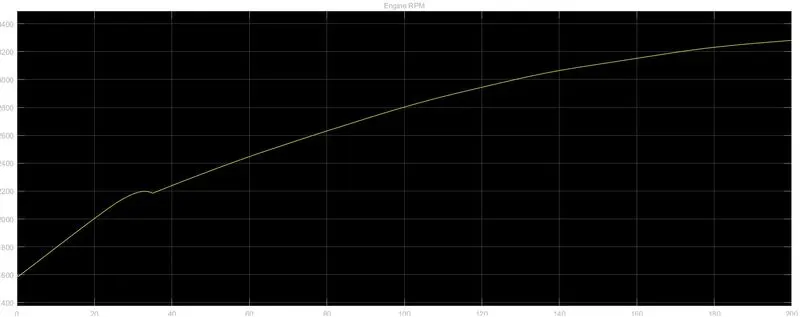
CVT Ratio
CVT Shaft Speed
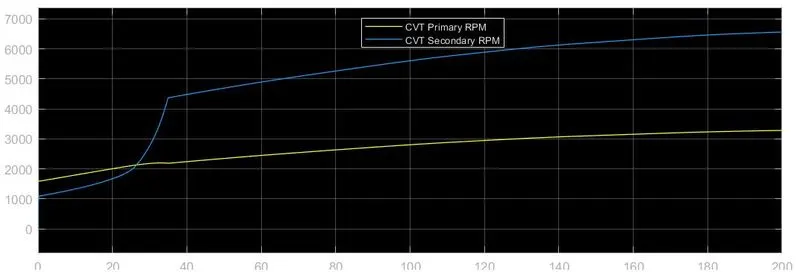
The CVT shows variation with respect to primary and secondary RMP based on their Gear Ratio.
Conclusion
System-level simulation of a BAJA All-Terrain Vehicle (ATV) with and without dashboard and Look-up Table has been carried out and based on the above-obtained results in the form of Engine Speed, Vehicle Speed, and CVT Shaft Speed helped to determine the vehicle’s performance.
A detailed study report of the model has been prepared.