OTTO CYCLE, p-v diagram and Efficiency of the cycle
% Program to plot p-v diagram for Otto Cycle
  clear
  close all
  clc

% Inputs
    gamma = 1.4;
    t3 = 2300;

% State variables at State point 1
    p1 = 101325;    % Presure at State 1(1ATM)
    t1 = 500;       % Temperature at state 1

% Engine geometric parameters
    bore = 0.1;     % Bore diameter
    stroke = 0.1;   % Length of stroke
    con_rod = 0.15; % Length of connecting rod
    cr = 12;        % Copmression ratio (cr=v1/v2)

% Calculating the swept volume and clearance volume
   % Swept volume is volume swept by the cylinder
        v_swept = (pi/4)*bore^2*stroke;
   % Clearance volume is volume available in cylinder when piston is at TDC
        v_clearance = v_swept/(cr-1);
   % Volume at state 1
        v1 = v_swept + v_clearance;
   % Volume at TDC
        v2 = v_clearance;

% State variables at State point 2
   % Pressure at state point 2
   % By the relation p1v1^gamma = p2v2^gamma
   % ie. p2 = p1(v1/v2)^gamma = p1*cr^gamma
        p2 = p1*cr^gamma;
   % To compute t2 we use idle ga law ie, pv/t is a constant
   % ie,p1v1/t1 = p2v2/t2, t2 = p2*v2*t1/(p1*v1)
        t2 = p2*v2*t1/(p1*v1);
   % Along Isentropic process, pv^gamma = constant
        constant_c  = p1*v1^gamma;
        V_compression = engine_kinematics(bore,stroke,con_rod,cr,180,0);
        P_compression = constant_c./V_compression.^gamma;

% State variables at State point 3
% State point 3 represents the end of point of constant vol. combustion
        v3 = v2;
   % Assume t3 = 2300K at the end of combustion process
   % p3 can be calculate by Idle gas law
   % p3v3/t3 = p2v2/t2, ie
        p3 = p2*t3/t2;
   % Along Isentropic process, pv^gamma = constant
        constant_c  = p3*v3^gamma;
        % Function 'engine_kinematics'
        V_expansion = engine_kinematics(bore,stroke,con_rod,cr,0,180);
        P_expansion = constant_c./V_expansion.^gamma;

% State variables at State point 4
  % Volume at state point 4 is equal to state point 1
        v4 = v1;
  % Pressure at state point 4
  % ie. p3v3^gamma = p4v4^gamma, ie p4 = p3*(v3/v4)^gamma
        p4 = p3*(v3/v4)^gamma;

% Now we got all State points and we can plot t he graph
        figure(1)   % Open new figure window
        hold on
% Plot the p-v Diagram with all the four State points values
        grid on
        plot(V_compression,P_compression);  % Reversible + Adiabatic compression
        plot([v2 v3],[p2 p3]);              % Constant volume heat addition
        plot(V_expansion,P_expansion);      % Reversible + Adiabatic expansion
        plot([v4 v1],[p4 p1]);              % Constant volume heat rejection
        title('P-V DIAGRAM FOR OTTO CYCLE');% Title for the Graph
        xlabel('Volume (v)');               % Labelling x-axis
        ylabel('Pressure (p)');             % Labelling y-axis

% Efficiency of Otto Cycle, Efficiency, E = 1-(1/(cr)^(gamma-1))
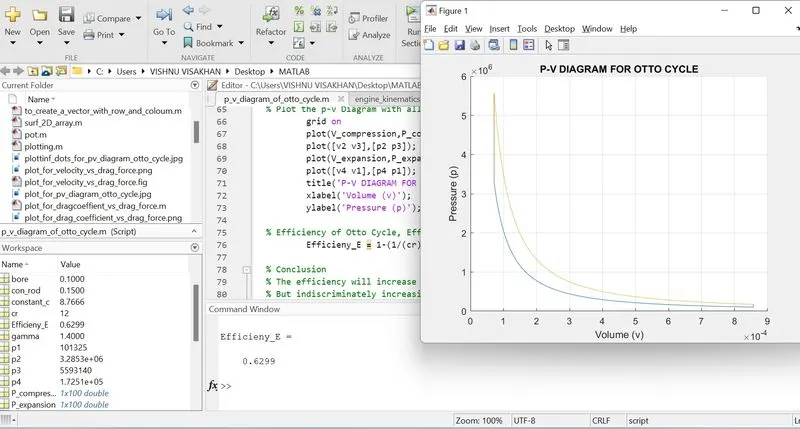
        Efficieny_E = 1-(1/(cr)^(gamma-1))

% Conclusion
% The efficiency will increase if we increase the value of compression ratio
% But indiscriminately increasing the compression ratio leads to increase in temperature
% Increase in Temperature to high extent will lead to Automatic Combustion
% Therefore, Efficiency of cycle is limited by Compression ratio.
function [V] = engine_kinematics(bore,stroke,con_rod,cr,start_crank,end_crank)
a = stroke/2; % Crank pin radius
R = con_rod/a;
v_s = pi/4*bore^2*stroke; % Swept volume
v_c = v_s/(cr-1); % Clearance volume
theta = linspace(start_crank,end_crank,100); % Crank angle
% Equation to calculate volume trace,V
% V = v_c(1 + (cr-1)(R+1-cosd(theta)-(R^2-(sind(theta)^2))^0.5)
% Splitting the equation into three called 'X','Y' and 'Z'
X = 0.5*(cr-1);
Y = R+1-cosd(theta);
Z = (R^2-sind(theta).^2).^0.5;
% Now putting all three terms into the equation
V = (1+X*(Y-Z)).*v_c;
end
PROJECT – 1
OTTO CYCLE
- AIM
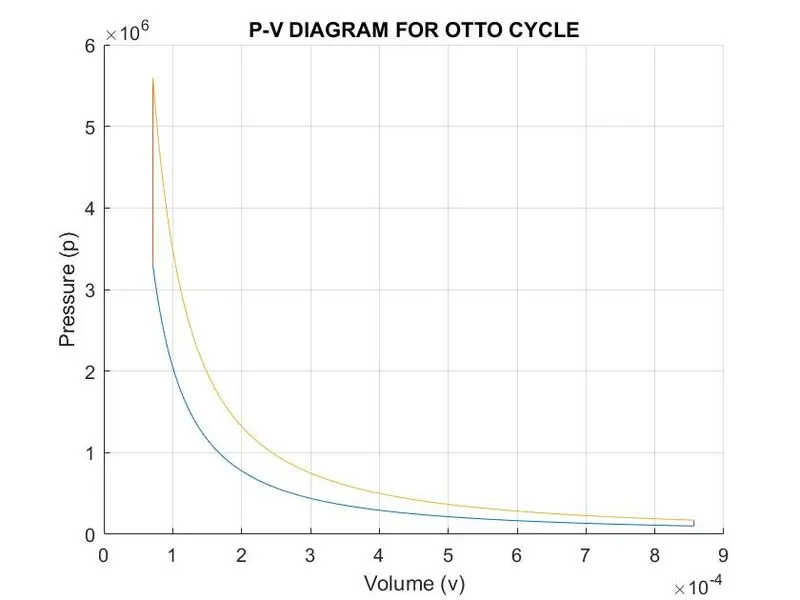
To Plot p-v diagram for Otto Cycle and find out the efficiency of the cycle.
- GOVERNING EQUATIONS
- Formula to determine the volumes inside an engine combustion chamber is going to
change
`V=V_(c )×(1+1/2 (cr-1)(R+1-costheta )-(R^2-(sin)^2 theta)^(1/2) )`
where,
Vc = Clearance volume,
cr = Compression ratio,
R = Length of connecting rod/Crank pin radius,
Crank pin radius = Stroke length/2,
= Crank angle
- Formula to determine the efficiency of the cycle
`Efficiency,E =1-1/(cr^(γ-1) )`
where,
cr = Compression ratio
- OBJECTIVE
- Process 1-2, Reversible + Adiabatic Compression
- Process 2-3, Constant volume heat addition
- Process 2-3, Constant volume heat addition
- Process 3-4, Reversible + Adiabatic Expansion
- The values for bore diameter, stroke length, connecting rod length and compression ratio is being provided.
- Swept volume is volume swept by the cylinder
- Clearance volume is volume available in the cylinder when the piston is at TDC
- BODY OF THE CONTENT
- Programming language used is HTML/XML
- There are four stages of Otto Cycle
- Each state is individually noted and the parameters are assigned
- After computing all the parameters, plot the p-v diagram
- Then finding the efficiency of the cycle
5. PROGRAMMING CODE-
% Program to plot p-v diagram for Otto Cycle
clear
close all
clc% Inputs
gamma = 1.4;
t3 = 2300;% State variables at State point 1
p1 = 101325; % Presure at State 1(1ATM)
t1 = 500; % Temperature at state 1% Engine geometric parameters
bore = 0.1; % Bore diameter
stroke = 0.1; % Length of stroke
con_rod = 0.15; % Length of connecting rod
cr = 12; % Copmression ratio (cr=v1/v2)% Calculating the swept volume and clearance volume
% Swept volume is volume swept by the cylinder
v_swept = (pi/4)*bore^2*stroke;
% Clearance volume is volume available in cylinder when piston is at TDC
v_clearance = v_swept/(cr-1);
% Volume at state 1
v1 = v_swept + v_clearance;
% Volume at TDC
v2 = v_clearance;% State variables at State point 2
% Pressure at state point 2
% By the relation p1v1^gamma = p2v2^gamma
% ie. p2 = p1(v1/v2)^gamma = p1*cr^gamma
p2 = p1*cr^gamma;
% To compute t2 we use idle ga law ie, pv/t is a constant
% ie,p1v1/t1 = p2v2/t2, t2 = p2*v2*t1/(p1*v1)
t2 = p2*v2*t1/(p1*v1);
% Along Isentropic process, pv^gamma = constant
constant_c = p1*v1^gamma;
V_compression = engine_kinematics(bore,stroke,con_rod,cr,180,0);
P_compression = constant_c./V_compression.^gamma;% State variables at State point 3
% State point 3 represents the end of point of constant vol. combustion
v3 = v2;
% Assume t3 = 2300K at the end of combustion process
% p3 can be calculate by Idle gas law
% p3v3/t3 = p2v2/t2, ie
p3 = p2*t3/t2;
% Along Isentropic process, pv^gamma = constant
constant_c = p3*v3^gamma;
% Function 'engine_kinematics'
V_expansion = engine_kinematics(bore,stroke,con_rod,cr,0,180);
P_expansion = constant_c./V_expansion.^gamma;
% State variables at State point 4
% Volume at state point 4 is equal to state point 1
v4 = v1;
% Pressure at state point 4
% ie. p3v3^gamma = p4v4^gamma, ie p4 = p3*(v3/v4)^gamma
p4 = p3*(v3/v4)^gamma;% Now we got all State points and we can plot t he graph
figure(1) % Open new figure window
% Plot the p-v Diagram with all the four State points values
grid on
plot(V_compression,P_compression); % Reversible + Adiabatic compression
plot([v2 v3],[p2 p3]); % Constant volume heat addition
plot(V_expansion,P_expansion); % Reversible + Adiabatic expansion
plot([v4 v1],[p4 p1]); % Constant volume heat rejection
title('P-V DIAGRAM FOR OTTO CYCLE');% Title for the Graph
xlabel('Volume (v)'); % Labelling x-axis
ylabel('Pressure (p)'); % Labelling y-axis% Efficiency of Otto Cycle, Efficiency, E = 1-(1/(cr)^(gamma-1))
Efficieny_E = 1-(1/(cr)^(gamma-1))% Conclusion
% The efficiency will increase if we increase the value of compression ratio
% But indiscriminately increasing the compression ratio leads to increase in temperature
% Increase in Temperature to high extent will lead to Automatic Combustion
% Therefore, Efficiency of cycle is limited by Compression ratio. -
function [V] = engine_kinematics(bore,stroke,con_rod,cr,start_crank,end_crank)
a = stroke/2; % Crank pin radius
R = con_rod/a;v_s = pi/4*bore^2*stroke; % Swept volume
v_c = v_s/(cr-1); % Clearance volumetheta = linspace(start_crank,end_crank,100); % Crank angle
% Equation to calculate volume trace,V
% V = v_c(1 + (cr-1)(R+1-cosd(theta)-(R^2-(sind(theta)^2))^0.5)
% Splitting the equation into three called 'X','Y' and 'Z'
X = 0.5*(cr-1);
Y = R+1-cosd(theta);
Z = (R^2-sind(theta).^2).^0.5;% Now putting all three terms into the equation
V = (1+X*(Y-Z)).*v_c;
end6. CONCLUSION
- The efficiency, E will increase if we increase the value of compression ratio.
- But indiscriminately increase the compression the compression ratio leads to increase in temperature
- Increase in temperature to high extent will lead to Automatic Combustion
- Therefore efficiency, E is limited by Compression ratio
7. PROBLEMS FACED
- Unable to upload the Programming code in INSERT/EDIT CODE SAMPLE.