Project 1 - Parsing NASA thermodynamic data
PROJECT -1
NASA FILE PARSING
Aim
To writs a code in MATLAB to parse NASA thermodynamic data file and then calculate thermodynamic properties of various gas species.
Objective
- To write a MATLAB program to extract the 14 coefficients from NASA thermodynamic data file.
- To calculate the enthalpy, entropy and specific heats for all the species in the data file.
- To plot the graphs of every species for the local temperature range (low temperature: high temperature)
- To find the molecular weight of all the species and display it in the command window.
- Save the plots as images with appropriate names and dumb them in separate folders for each species with suitable name, generated automatically.
Theory
File parsing is done to extract data from the file, it should be as generic as possible to fetch the data from different files. In this program we are getting the 14 coefficients from the data and by using this we calculate enthalpy, entropy and specific heat for different species and the condition is that the FIRST 7 coefficients are HIGH-temperature coefficients and the SECOND 7 coefficients are LOW- temperature coefficients.
Equations used
For specific heat,
`(cp)/R=a1+a2.T+a3.T^2+a4.T^3+a5.T^4`
For enthalpy,
`H/(RT)=a1+a2 T/2+a3 T^2/3+a4 T^3/4+a5 T^4/4+(a6)/T`
For entropy,
`S/R=a1.log(T)+b2.T+b3.T^2/2+b4.T^3/3+b5.T^4/4+b7`
where,
T=Local temperature
a1-a7=high temperature coefficients
a8-a14= low temperature coefficients
R=gas constant=8.314
Program for file Parsing
clear all
close all
clc

% Reading THERMO data file
f1=fopen('THERMO.dat','r')
first_line= fgetl(f1);

%reading global temperatures
Temp=fgetl(f1)
T=strsplit(Temp,' ');
global_low_temp= str2num(T{2});
global_mid_temp= str2num(T{3});
global_high_temp= str2num(T{4});

%skipping next three lines
for i=1:3
    fgetl(f1);
end

% defining all species individually
for k=1:53
    tline=fgetl(f1);
    A=strsplit(tline,' ');
    species_names=(A{1});


% reading local temp for each individual species
local_low_temp = str2num(A{end-3});
local_mid_temp = str2num(A{end-1});
local_high_temp = str2num(A{end-2});

%% Extracting 14 coefficients
% Reading 1st values
tline=fgetl(f1);
a=findstr(tline,'E');
tline(12)
tline(1:12);
tline(1:12+3);
a1=str2num(tline(1:a(1)+3));
a2=str2num(tline(a(1)+4:a(2)+3));
a3=str2num(tline(a(2)+4:a(3)+3));
a4=str2num(tline(a(3)+4:a(4)+3));
a5=str2num(tline(a(4)+4:a(5)+3));
% Reading 2nd line values
tline=fgetl(f1);
a=findstr(tline,'E');
a6=str2num(tline(1:a(1)+3));
a7=str2num(tline(a(1)+4:a(2)+3));
a8=str2num(tline(a(2)+4:a(3)+3));
a9=str2num(tline(a(3)+4:a(4)+3));
a10=str2num(tline(a(4)+4:a(5)+3));
%Reading 3rd line values
tline=fgetl(f1);
a=findstr(tline,'E');
a11=str2num(tline(1:a(1)+3));
a12=str2num(tline(a(1)+4:a(2)+3));
a13=str2num(tline(a(2)+4:a(3)+3));
a14=str2num(tline(a(3)+4:a(4)+3));

% defining Temp ranges
T=linspace(local_low_temp,local_high_temp,1000);

% universal gas constant
R=8.3145; %in j/mol-k
% calculating specific heat,enthalpy,entropy

cp=specific_heat(a1,a2,a3,a4,a5,a8,a9,a10,a11,a12,R,T,local_mid_temp);

H=enthalpy(a1,a2,a3,a4,a5,a6,a8,a9,a10,a11,a12,a13,R,T,local_mid_temp);

S=entropy(a1,a2,a3,a4,a5,a7,a8,a9,a10,a11,a12,a14,R,T,local_mid_temp);

M=molecular_weight(species_names);

% Creating sepearte directory to store graphs and values of each species
% cd('C:users shiva prasad Desktop file_prasing_NASA');


% writing molecular weight to a text file
M_file=fopen('molecular weight.txt','w');
fprintf(M_file,'molecular weight of %s ; %f',species_names,M);
fclose(M_file)
mkdir(species_names);
cd(species_names);

%plotting temp vs cp graphs and saving
figure(1)
plot(T,cp)
xlabel('Temp(k)')
ylabel('specific heat(kj)')
title(sprintf('Temp vs specific heat of %s',species_names))
grid on
saveas(1,'specific heat','jpg')

figure(2)
plot(T,H);
xlabel('Temp(k)');
ylabel('Enthalpy(kj/mol)');
title(sprintf('Temp vs Enthalpy of %s',species_names));
grid on
saveas(2,'Enthalpy','jpg');

figure(3)
plot(T,S);
xlabel('Temp(k)');
ylabel('Entropy(kj/mol-k)');
title(sprintf('Temp vs Entropy of %s',species_names));
grid on
saveas(3,'Entropy','jpg');
cd ..
end

%changing directory to orginal directory
% cd('E:\SOFTWARE\MathWorks_MATLAB_R2021a_v9.10.0.1602886\Installation\bin\MATLAB\NASA File Parsing')
Function Code for calculating the Molecular weight
function [W] = molecular_weight(species)

    atomic_names = ['H', 'C', 'O', 'N', 'Ar'];
    atomic_weights = [1.00784, 12.0107, 15.999, 14.0067, 39.948];
    W=0;

    for i=1:length(species)
        for j=1:length(atomic_names)
            if species(i)==atomic_names(j)
                W=W+atomic_weights(j);
                position = j;
            end
        end
        n=str2num(species(i));
        if n>=1
            W=W+atomic_weights(position)*(n-1);
        end
    end
    fprintf('Molecular weight of %s = %f',species,W)
    disp(' ')
end
Function for calculating entropy
function [S] = entropy(a1,a2,a3,a4,a5,a7,a8,a9,a10,a11,a12,a14,tmid,T,R)

    % finding entropy with low and temperature variables
    if T<=tmid
        S = ((a8*log(T))+(a9*T)+(a10*(T.^2)/2)+(a11*(T.^3)/3)+(a12*(T.^4)/4)+a14)*R;
    else
        S = ((a1*log(T))+(a2*T)+(a3*(T.^2)/2)+(a4*(T.^3)/3)+(a5*(T.^4)/4)+a7)*R;
    end

end
Function for calculating specific heat
function [cp] = specific_heat(a1,a2,a3,a4,a5,a8,a9,a10,a11,a12,tmid,T,R)

    % finding specific heat with low and temperature variables
    if T<=tmid
        cp = (a8+(a9*T)+(a10*T.^2)+(a11*T.^3)+(a12*T.^4))*R;
    else
        cp = (a1+(a2*T)+(a3*T.^2)+(a4*T.^3)+(a5*T.^4))*R;
    end

end
Function for calculating enthalpy
function [H] = enthalpy(a1,a2,a3,a4,a5,a6,a8,a9,a10,a11,a12,a13,tmid,R,T)

    % finding enthalpy with low and temperature variables
    if T<=tmid
        H = (a8+(a9*T/2)+(a10*(T.^2)/3)+(a11*(T.^3)/4)+(a12*(T.^4)/5)+(a13./T))*R.*T;
    else
        H = (a1+(a2*T/2)+(a3*(T.^2)/3)+(a4*(T.^3)/4)+(a5*(T.^4)/5)+(a6./T))*R.*T;
    end

end
Explanation for the code
- dat file is imported to the program by using ‘fopen’ command.
- Each and every line is read by using ‘fgetl’
- In order to get the header information ‘strsplit’ command is used to split the string and the global temperatures are fetched.
- Next three statements are irrelevant, hence it is skipped by using the ‘fgetl’ line inside the ‘for loop’.
- The species first line contains the species_name and the next three lines contains the coefficients.
- Hence by using ‘strsplit’ command the species_name and the local temperatures are obtained.
- In order to get the coefficients ‘strfind’ command is used to find the variableE by using this as reference coefficients are assigned.
- To create a separate folder to save the plot for every species ‘mkdir’ command is used.
- For plotting we need a set of temperatures hence the local species temperature is splitted into 1000 points by using ‘linspace’
- To assign the high and low temperature coefficients each and every local temperature compared with the local mid temperature.
- Thus, by using the formulae specific heat, entropy and enthalpy are calculated in separate function.
- Plot for specific heat, enthalpy and entropy is plotted and the figure is saved using ‘cd’ command.
- To find the molecular weight function is called.
- Molecular weight is calculated by assigning atomic weight of each and every element by using ‘strcmp’ command.
- Each species elements are compared and molecular mass is stored using two ‘for loops ‘, one to iterate the species element and one to compare the elements.
- In some species like HNO3 the element’s atomic weight to be added twice (or) thrice, hence flag operator is used to get the position and that element atomic weight is added to the molecular weight by using the ‘if’ condition.
Errors faced
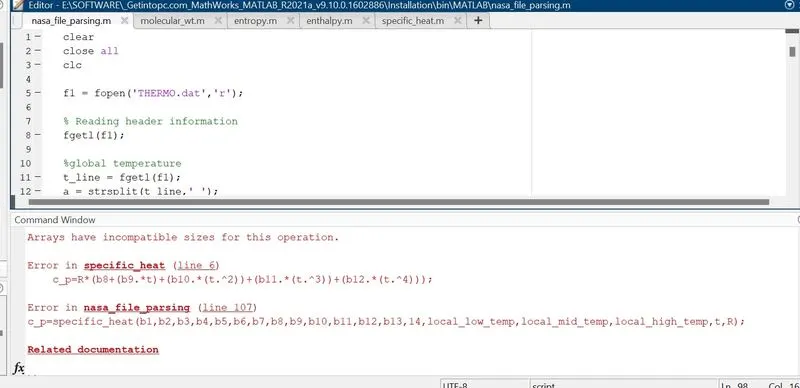
Problem with code, and was corrected and changed.
Output
- For O2
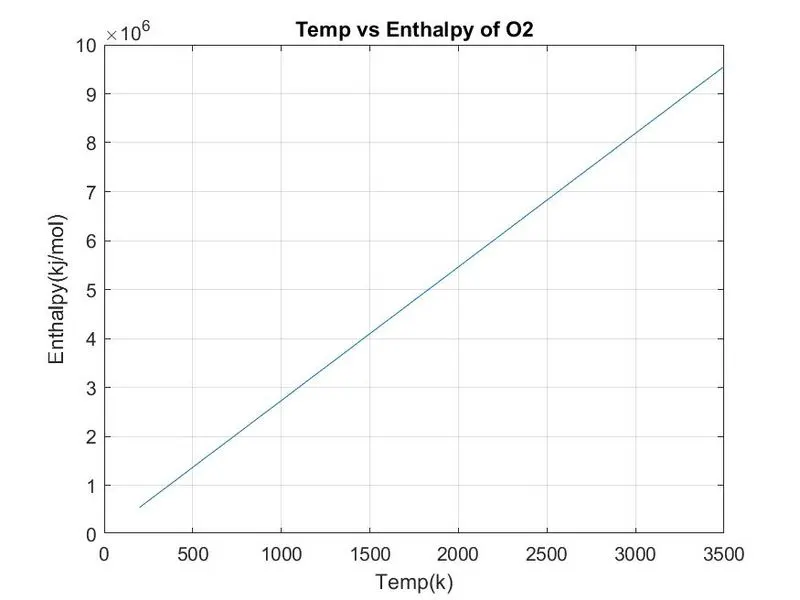
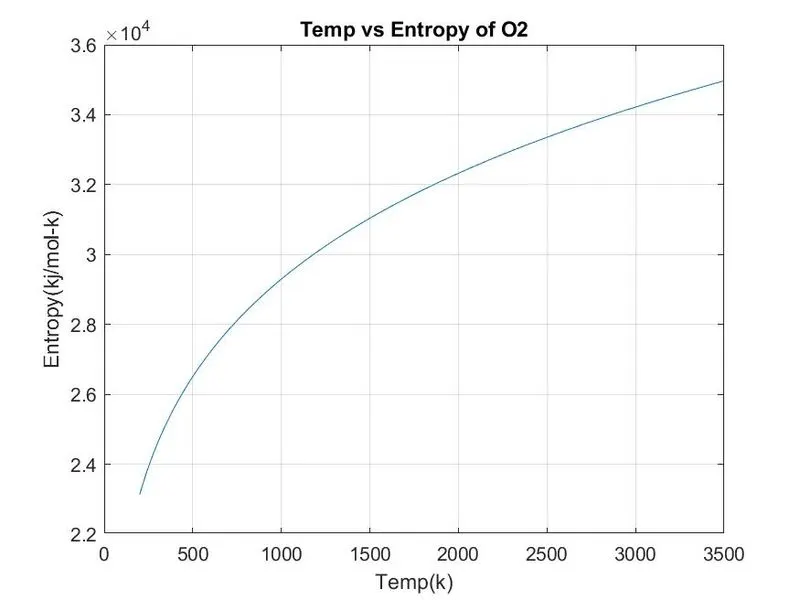
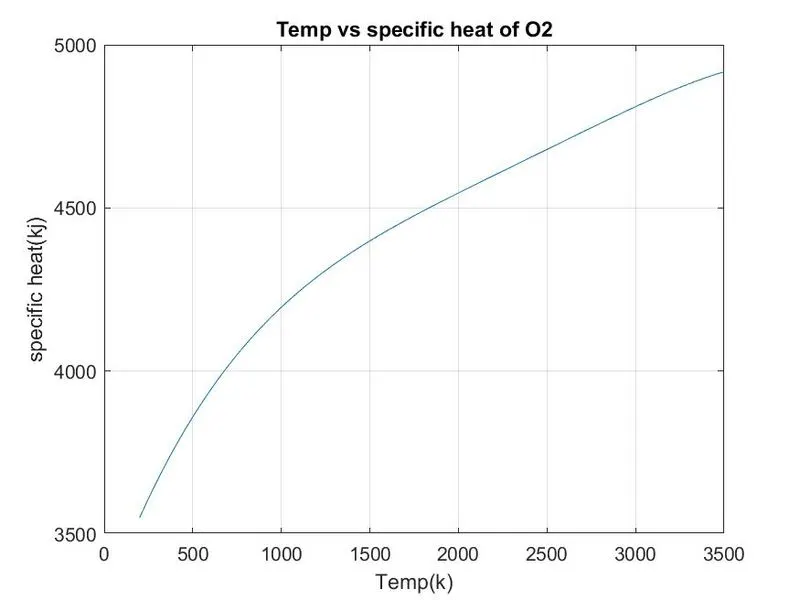
2. For N2
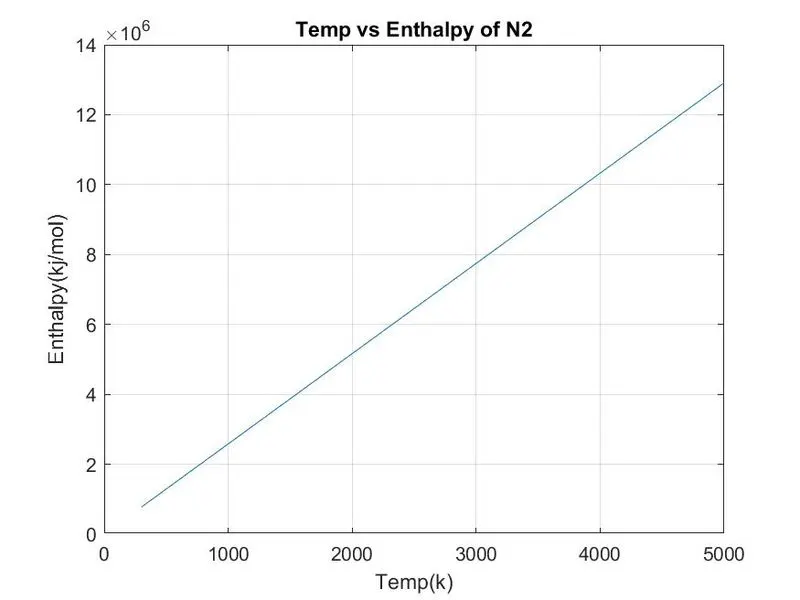
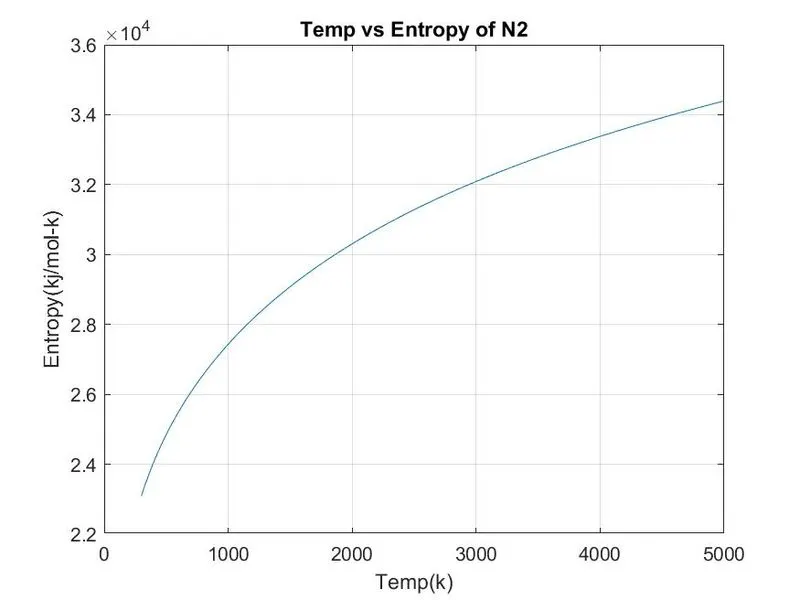
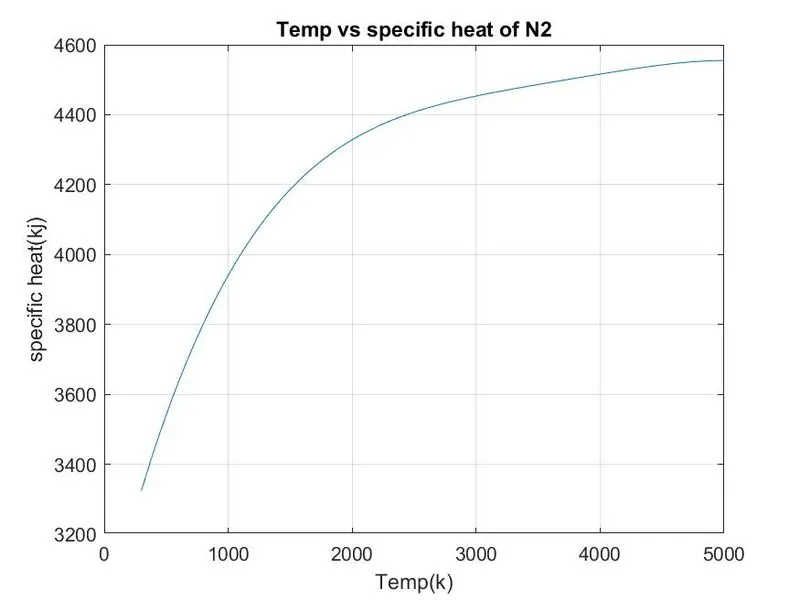
3. For CO2
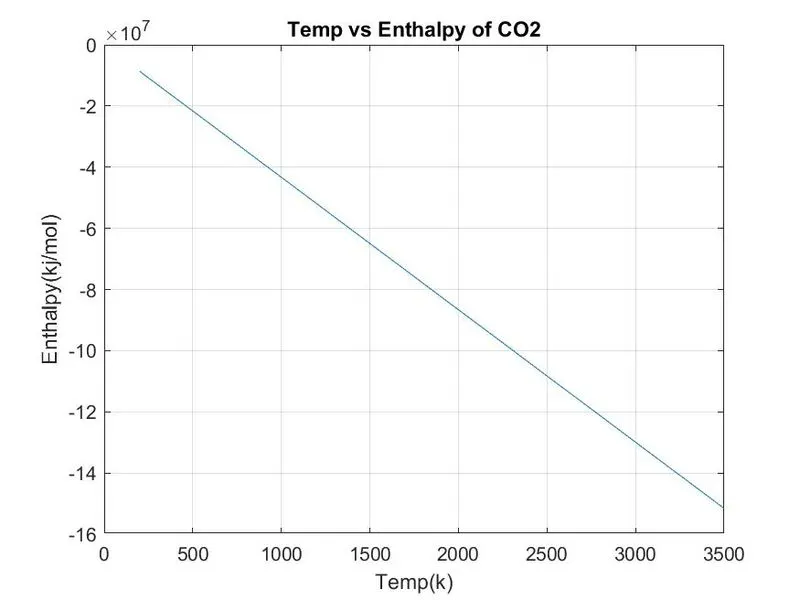
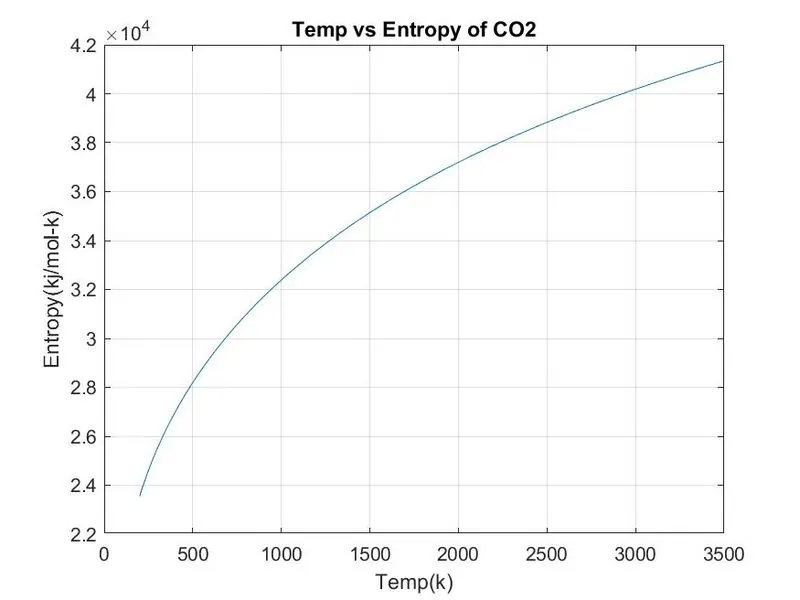
Molecular Weight
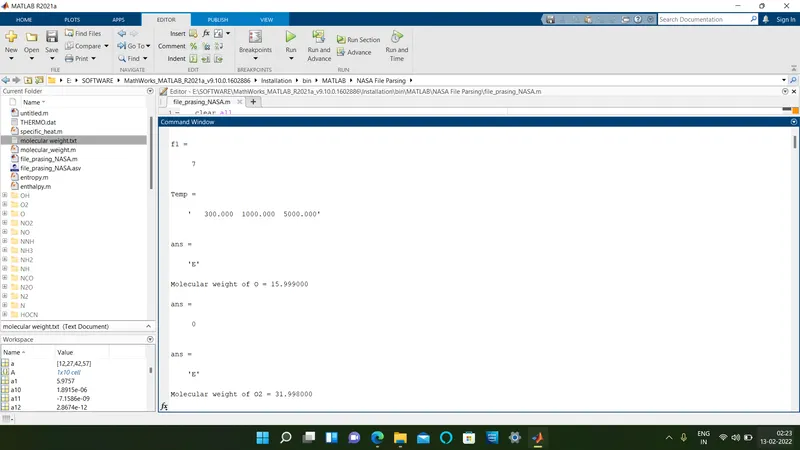
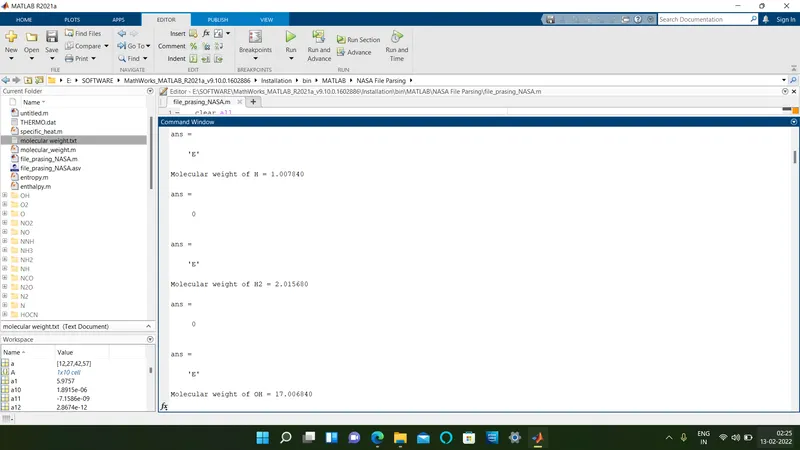
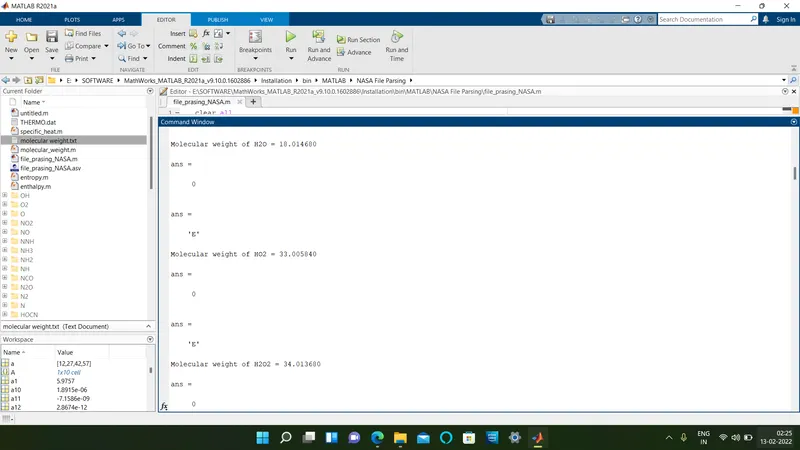
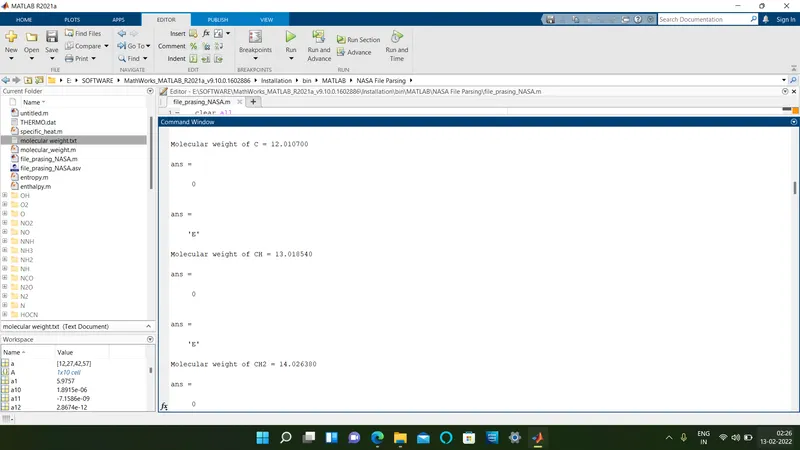
Folders generated and saved

Result
- The code for file parsing is done.
- The graphs for N2, O2 and CO2 is plotted.
- Molecular weight for every element is found.
- Files are created for individual species and graphs plotted are saved in it.