Project
Aim:
Carry out a system-level simulation of an all-terrain vehicle.
Download the model from the given link:
https://www.mathworks.com/matlabcentral/fileexchange/70576-baja-all-terrain-vehicle-atv-model
Prepare a technical report explaining the model properties & comments on the results.
Introduction:
ATV:
An all-terrain vehicle (ATV), also known as a light utility vehicle (LUV), a quad bike, or simply a quad is a vehicle that travels on low-pressure tires, with a seat that is straddled by the operator, along with handlebars for steering control. As the name implies, it is designed to handle a wider variety of terrain than most other vehicles.
The demand for ATVs has witnessed a rise in the agricultural sector for various farm-related activities, such as weed control, fence mending, field ploughing, general transportation, and animal handling. They are also used in applications such as manufacturing, construction, utilities, mining, and search and rescue.
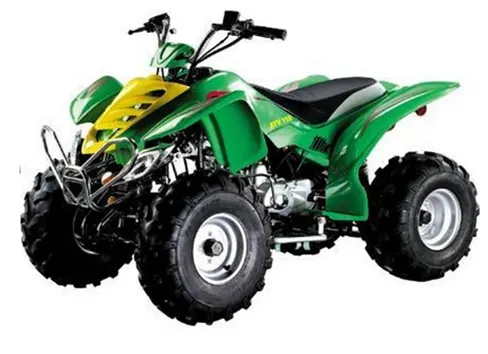
Fig 1: All-Terrain Vehicle
CVT:
A CVT, or continuously variable transmission, seamlessly changes through an unending range of effective gear ratios while you drive, whereas other kinds of mechanical transmissions offer a fixed number of gear ratios and have hard shifts between each. CVT transmission systems are also known as single-speed, shiftless, and stepless transmissions.
A CVT gearbox has a relatively simple arrangement of two cone-shaped pulleys with a V-shaped drive belt connecting them. One pulley is attached to the engine, while the other is joined to the wheels. When you press the accelerator, the engine revs and the cone move according to the amount of power asked for. The other cone adjusts accordingly so that the drive belt maintains the same tension, and this is what determines how the car accelerates.
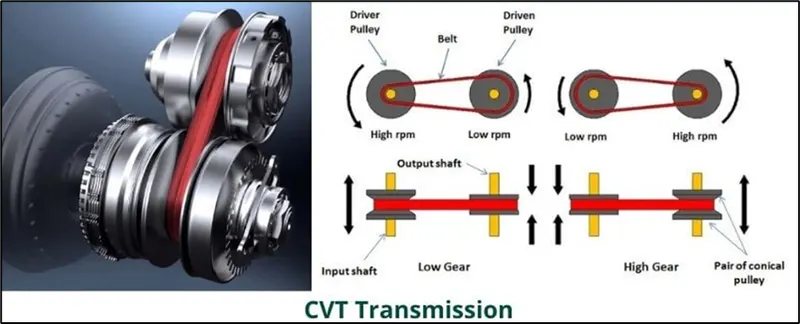
Fig 2: CVT Transmission
In this study, an all-terrain vehicle with CVT transmission, simulation modelling in different ways and results will be understand.
Theory:
Below simulation model studies will be done in this report:
- Study 1: CVT model without Dashboard
- Study 2: CVT model with Dashboard
- Study 3: CVT model with lookup table and without dashboard
- Study 4: CVT model with lookup table and with dashboard
Below blocks/parameters are common in all studies:
- Generic Engine: Represents a system-level model of spark-ignition and diesel engines suitable for use at initial stages of modelling when only the basic parameters are available. Refer fig. 3 for Generic engine parameters. Speed vector and Torque vector inputs are provided as variables which values are defined in simulink workspace as shown in fig 4.
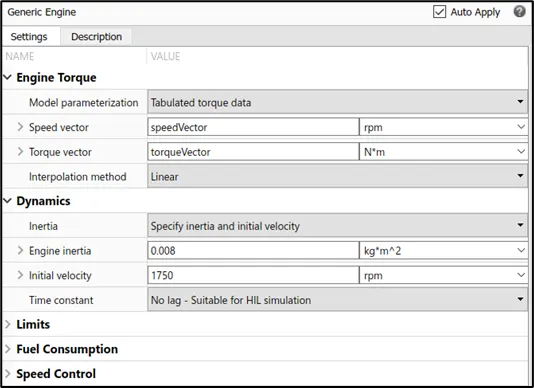
Fig 3: Generic engine parameters
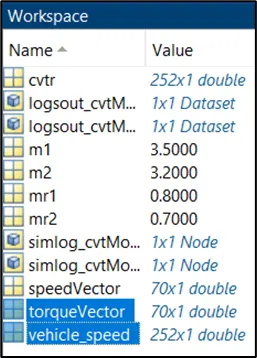
Fig 4: Speed vector and Torque vector values in workspace
- Engine sensor subsystem: This subsystem consists of RPM sensor and scope block. Scope is used to monitor Engine RPM and Engine RPM is logged. Refer fig. 5 for Engine sensor subsystem.
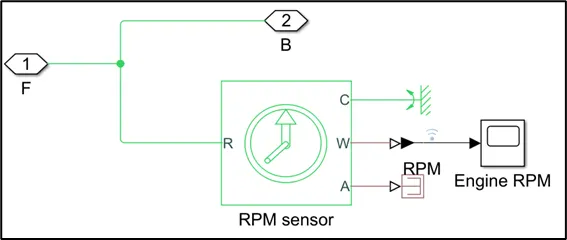
Fig 5: Engine sensor subsystem picture
- CVT subsystem: A CVT system consists of a primary and secondary pulley.
- In CVT subsystem, each pully consists of Input and output shaft Inertia and Ideal rotational motion sensors (to monitor RPM) attached to both of the pulleys.
- Both pulleys are connected through variable ratio gear transmission. A variable ration gear transmission represents a variable ratio gearbox such as implemented by mechanical belt CVT, electric, or hydraulic transmissions.
- Refer fig. 6 for CVT subsystem.
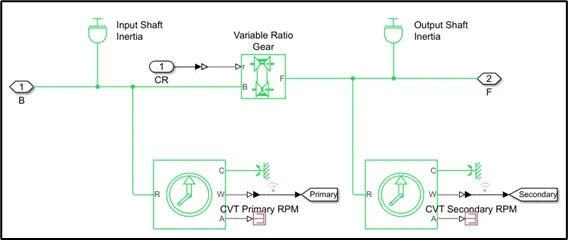
Fig 6: CVT subsystem picture
- Simple Gear: Gear ratio is 10. It is used to reduce the speed to connect the CVT and vehicle body.
- Vehicle body subsystem: A vehicle body subsystem consists of vehicle body block, 4 tire blocks, double shoe break block. Inclination and wind velocity is provided to the vehicle body block. Refer fig. 7 for Vehicle body subsystem.
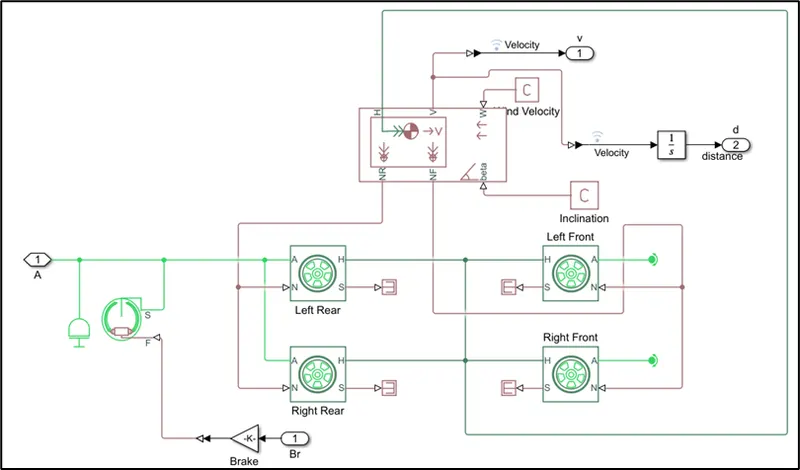
Fig 7: Vehicle body subsystem picture
1. Study 1: CVT model without Dashboard
Refer to below simulation model picture:
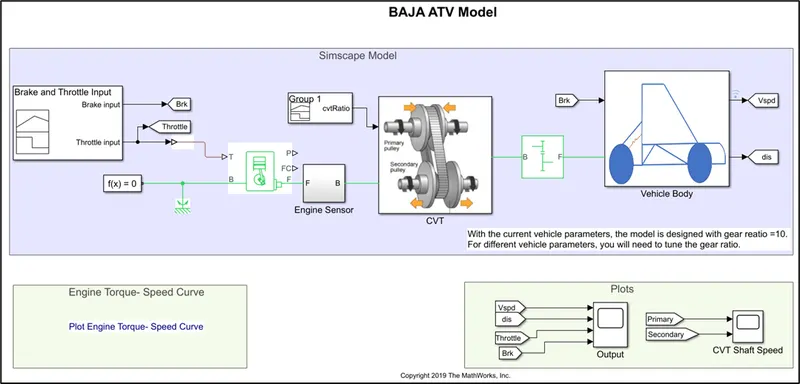
In this model, simulation time is 200 secs:
- Brake and Throttle body input is given by signal builder as shown in fig. 8.
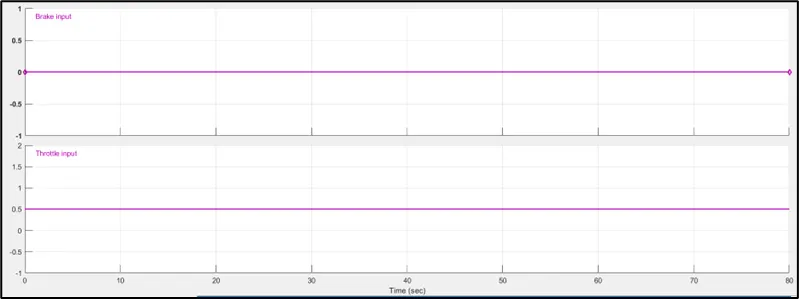
Fig 8: Brake and Throttle input
- Throttle input is provided to generic engine.
- Generic engine output shaft is connected to CVT primary pully.
- CVT ratio input is given through signal builder as shown in fig. 9.
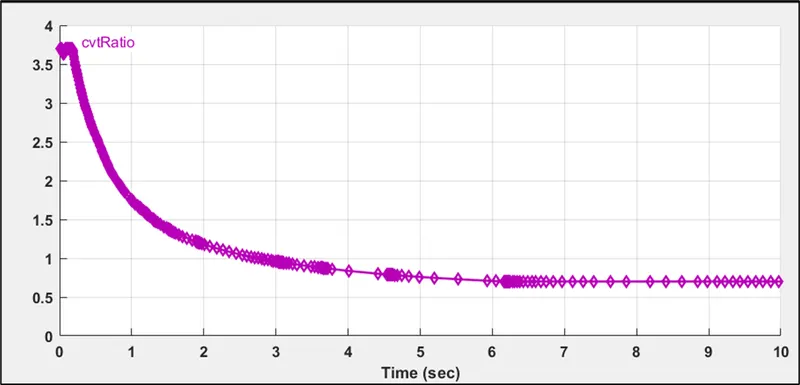
Fig 9: CVT ratio input
- CVT ratio input is provided to the variable ratio gear block.
- CVT subsystem secondary pulley output is connected to Simple gear.
- Simple gear is connected to vehicle body rear tires axle.
Refer below graph for vehicle velocity, distance output and Throttle and Brake input:
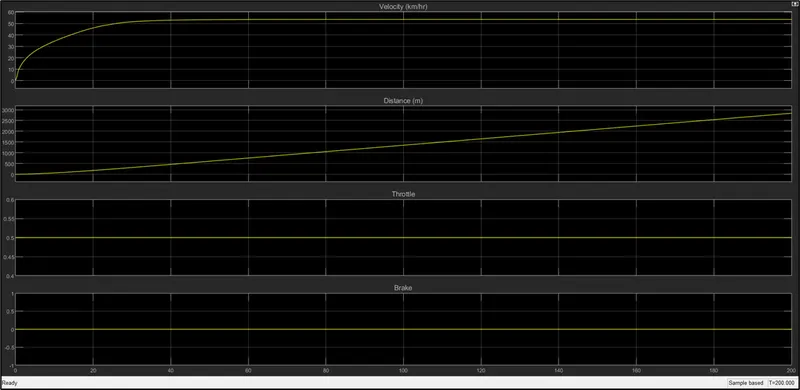
Observation from above result:
- After few seconds, vehicle velocity is increasing and distance travelled also increases.
Refer below graph for CVT primary and Secondary pulley RPM:
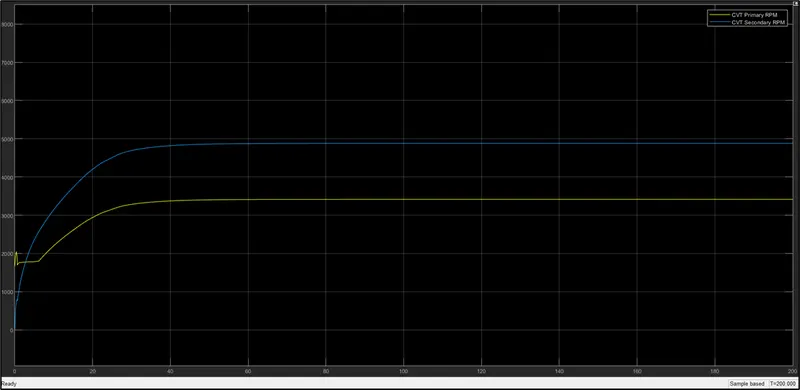
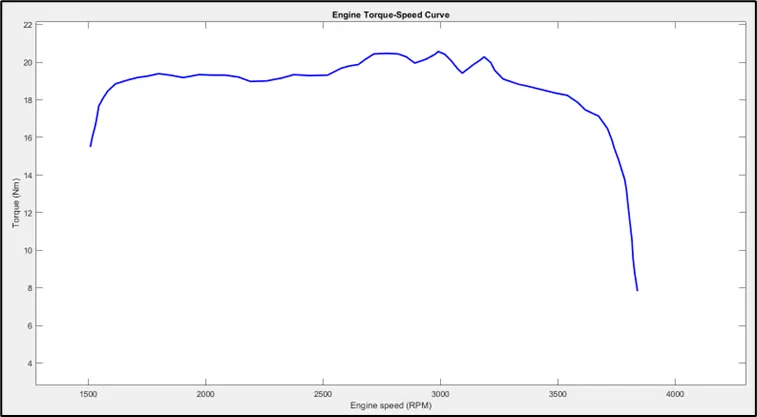
Refer below graph for Engine Torque-Speed curve input:
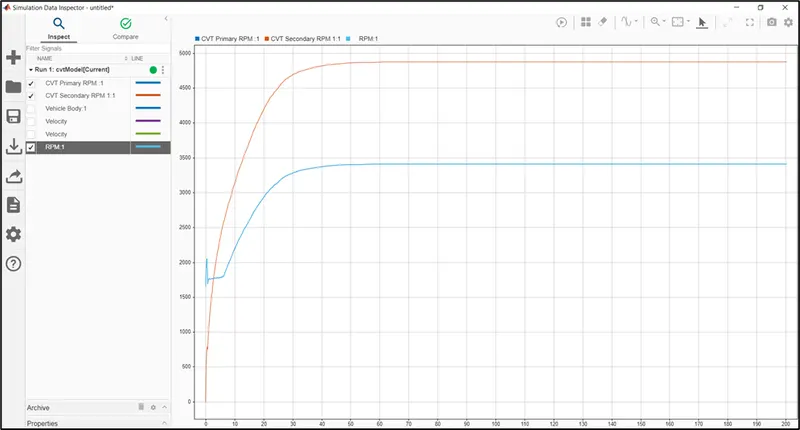
Refer below graph for CVT primary and secondary RPM and engine RPM:
Observation from above result:
- CVT primary pulley RPM and Engine RPM graph is same because CVT primary pulley is connected to the engine output shaft.
2. Study 2: CVT model with Dashboard
Refer to below simulation model picture:
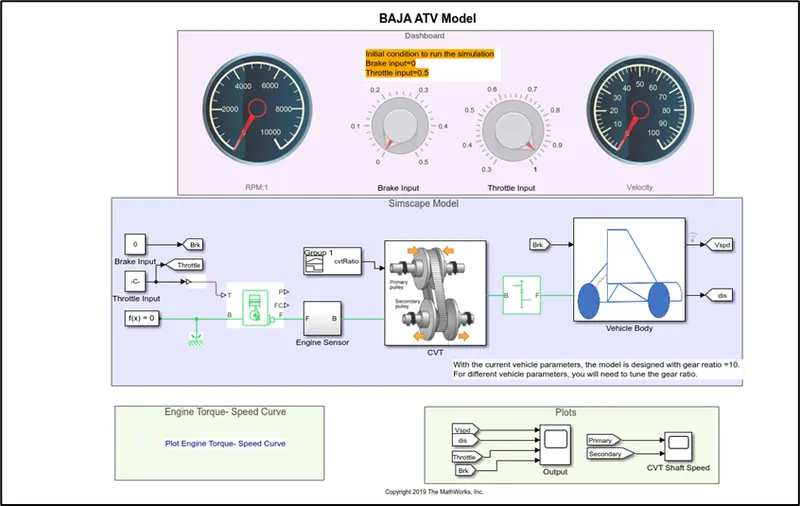
In this model, simulation time is inf secs:
- This model is similar to “CVT model without Dashboard”, only difference is that Break and Throttle inputs are provided through “Knob” dashboard. Addition to that Engine RPM and Vehicle body velocity are displayed in “circular gauge” dashboard.
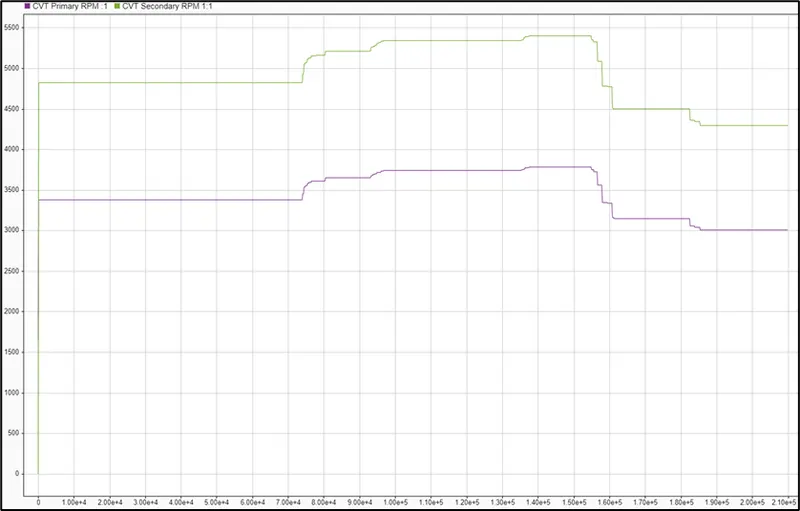
Refer below graph for CVT primary and secondary RPM:
Observation from above result:
- Primary and secondary RPM response changes as per the knob rotation of Throttle input during simulation run.
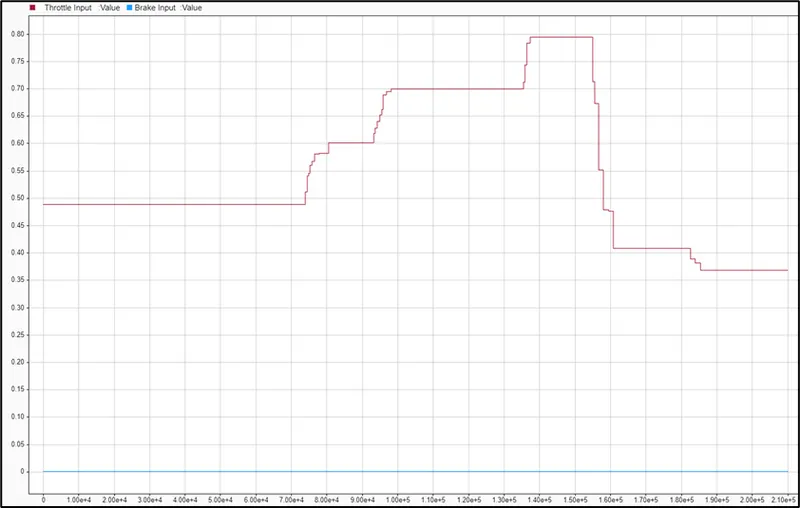
Refer below graph for Throttle and Brake input:
3. Study 3: CVT model with lookup table and without dashboard
Refer to below simulation model picture:
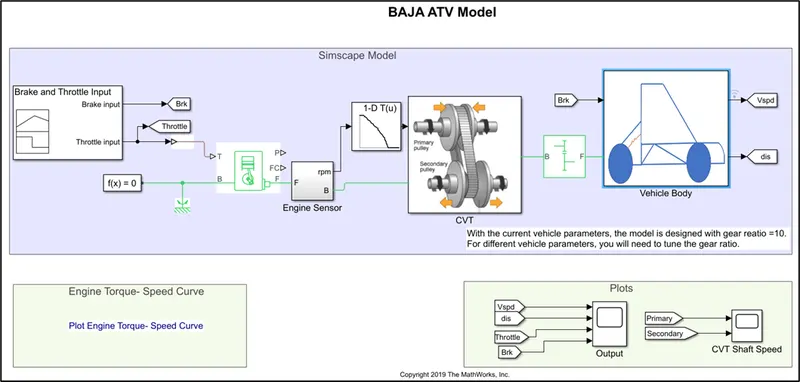
In this model, simulation time is 50 secs:
- This model is similar to model “CVT model without Dashboard” except CVT ratio input is provided through 1-D lookup table. Also, this model is taking reference from Engine RPM so it has closed loop control compared to open control loop in study-1.
- 1-D lookup table block maps Engine RPM (input) to CVT gear ratio (output) value by looking up or interpolating a table of values define with block parameters.
- Block parameters are shown in fig. 10. cvtr and speedV variables are provided in workspace.
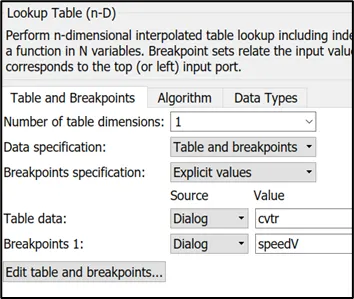
Fig 10: Lookup table input parameters
Refer below graph for vehicle velocity, distance output and Throttle and Brake input:
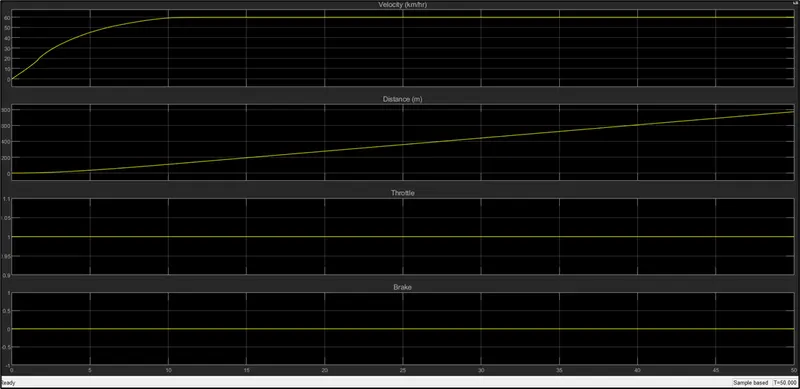
Observation from above result:
- After few seconds, vehicle velocity is increasing and distance travelled also increases.
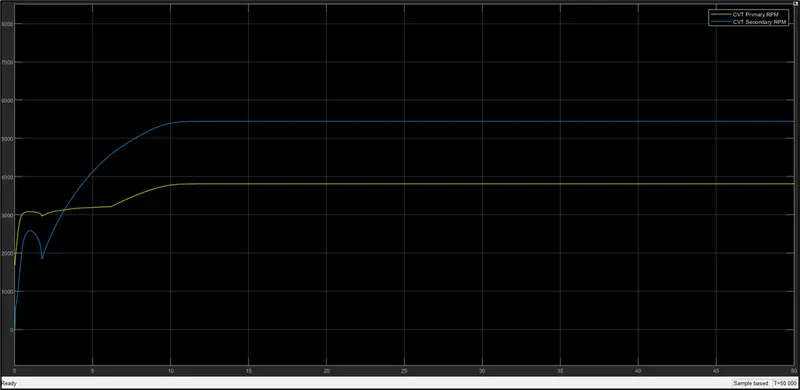
Refer below graph for CVT primary and Secondary pulley RPM:
4. Study 4: CVT model with lookup table and with dashboard
Refer to below simulation model picture:
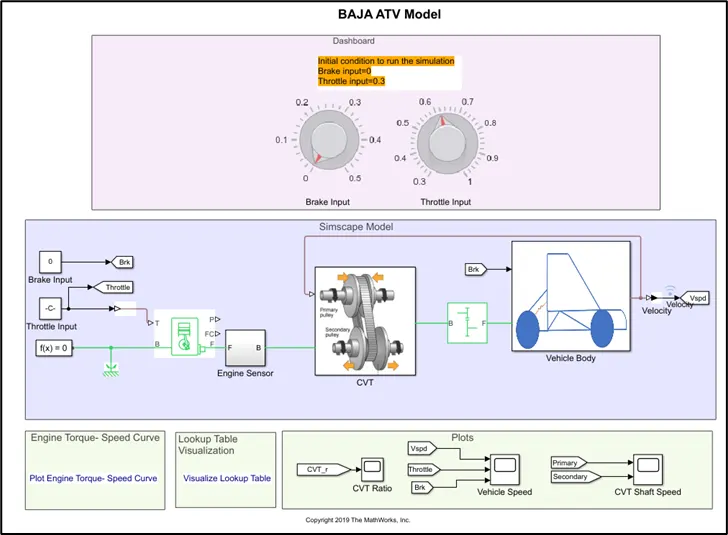
In this model, simulation time is inf secs:
- This model is similar to model “CVT model with Dashboard” except CVT ratio input is provided through 1-D lookup table. Also, this model is taking reference from Engine RPM so it has closed loop control compared to open control loop in study-1.
- 1-D lookup table block maps Vehicle Speed (input) to CVT gear ratio (output) value by looking up or interpolating a table of values define with block parameters.
- Block parameters are shown in fig. 11. cvtr and speedV variables are provided in workspace. Lookup table visualization is shown in fig. 12.
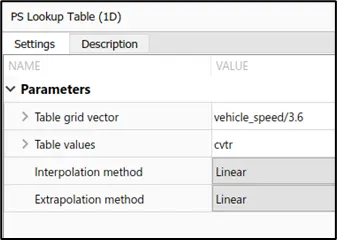
Fig 11: Lookup table input parameters
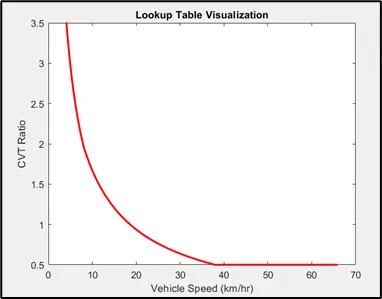
Fig 12: Lookup table visualization
Refer below graph for CVT primary and secondary RPM:
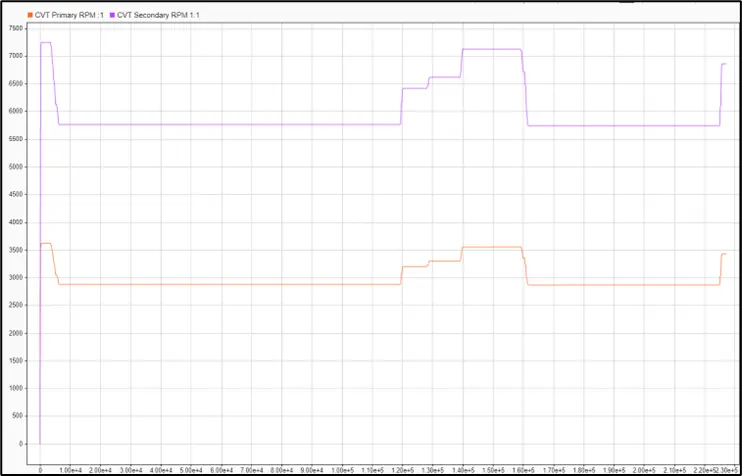
Observation from above result:
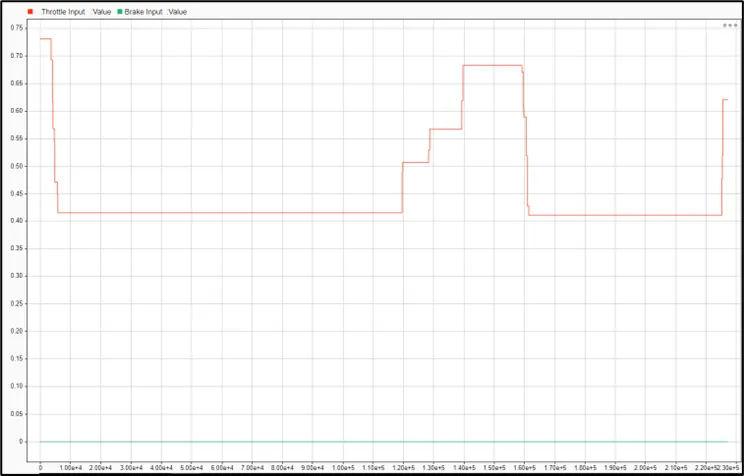
- Primary and secondary RPM response changes as per the knob rotation of Throttle input during simulation run.
Refer below graph for Throttle and Brake input:
Summary:
All-terrain vehicle with CVT transmission modelling simulink with different types of input methods and control methods is understood. Also, how to record and observe the data in different ways is understood.