AIM: To study the system level of simulation of ATV(All-terrain vehicle) by using Simulink.
CASE STUDIES:
- Study of BAJA ATV model with a dashboard.
- Study of BAJA ATV model without a dashboard.
- Stuy of BAJA ATV model using a lookup table with a dashboard.
- Study of BAJA ATV model using lookup table without a dashboard.
INTRODUCTION:
Transmission of an Engine, which is used to transmit the power for the engine to wheels by using shafts as a power transmitter.
Transmission of an Engine classification:
- Manual Transmission
- Semi-automatic Transmission
- Automatic Transmission
- Continous Variable Transmission(CVT)
Here in this Model, we are going to discuss CVT-type transmission.
Continuously Variable Transmission(CVT):
Unlike traditional automatic transmissions, continuously variable transmissions don't have a gearbox with a set number of gears, which means they don't have interlocking toothed wheels.
The most common type of CVT operates on an ingenious pulley system that allows an infinite variability between the highest and lowest gears with no discrete steps or shifts.
Figure 1
If you're wondering why the word "gear" still appears in the explanation of a CVT, remember that broadly speaking, gear refers to a ratio of engine shaft speed to driveshaft speed. Although CVTs change this ratio without using a set of planetary gears, they are still described as having low and high "gears" for the sake of convention.
A CVT will draw engine power from the top in the small engine, which gives quicker acceleration than standard automatic transmission. why because of their greater ability to control the engine speed range, CVTs produce fewer emissions.
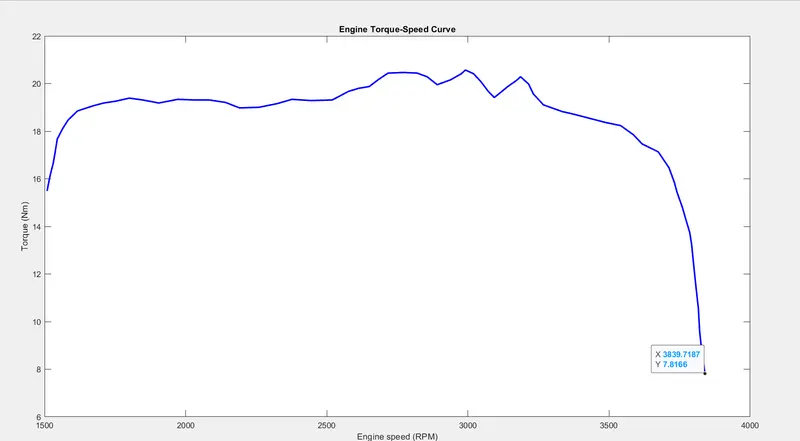
Since the value of the Engine Torque speed curve is given at 3839.71 rpm corresponding Torque value of 7.81 is the maximum for this simulation.
Figure 2
Case Study 1:
Study of Baja ATV without DASHBOARD:
Figure 3
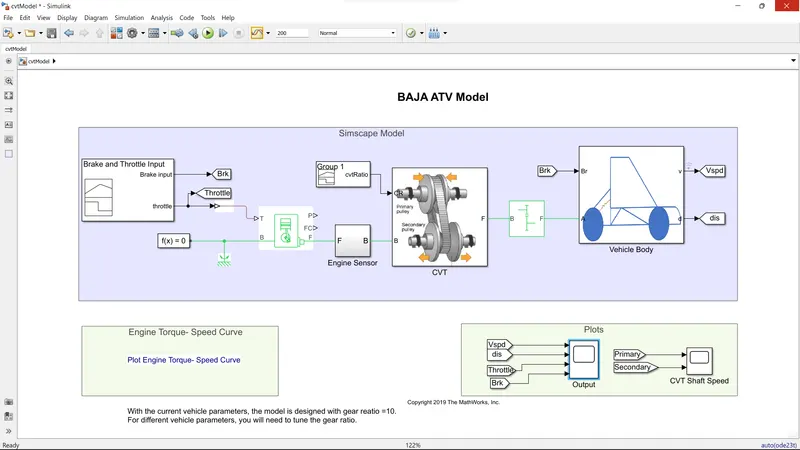
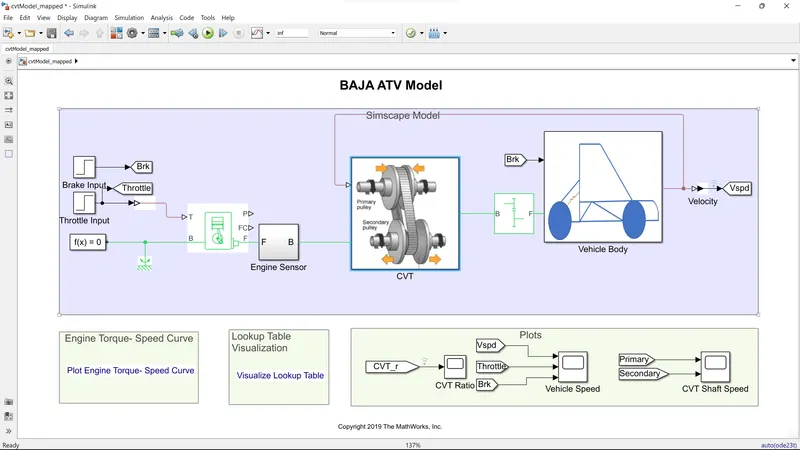
In this BAJA ATV model(figure1), it consists of a signal builder, Generic engine, Engine motion sensor, vehicles transmission, Body of vehicle, Slover configuration, Gears, and more sub-system, Goto, etc.., by using the Simulink model we are going to perform the operation and to see the results.
GENERIC ENGINE:
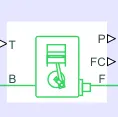
The Generic Engine block represents a general internal combustion engine. This block is a suitable generic engine for spark-ignition and diesel. Speed-power and speed-torque parameterizations are provided. A throttle physical signal input specifies the normalized engine torque.
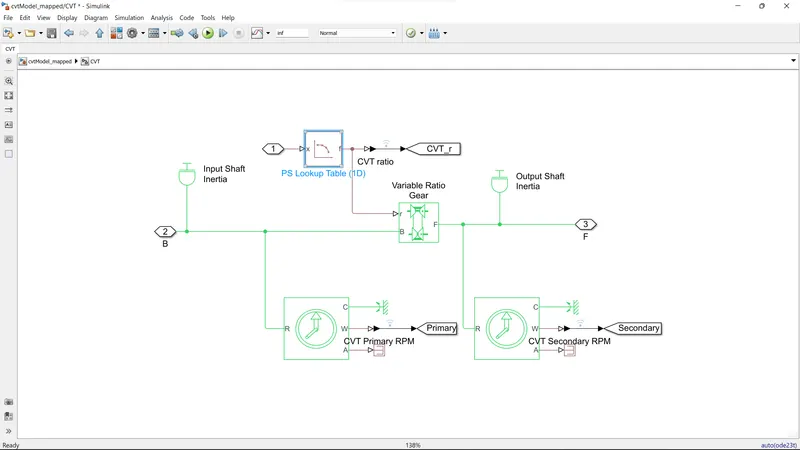
A sub-system of CVT blocks (figure4):
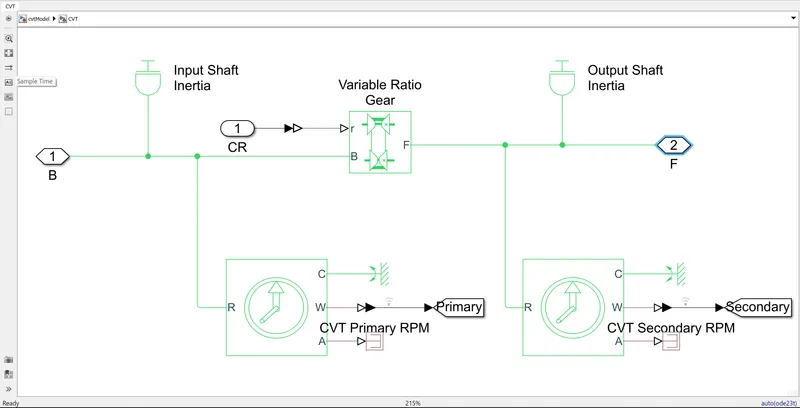
In this sub-system input/output inertia of the shaft is connected parallel to variable gear ratio blocks.
Due to this CVT, there are two motion sensors available one is a primary motion sensor and another is a secondary motion sensor.
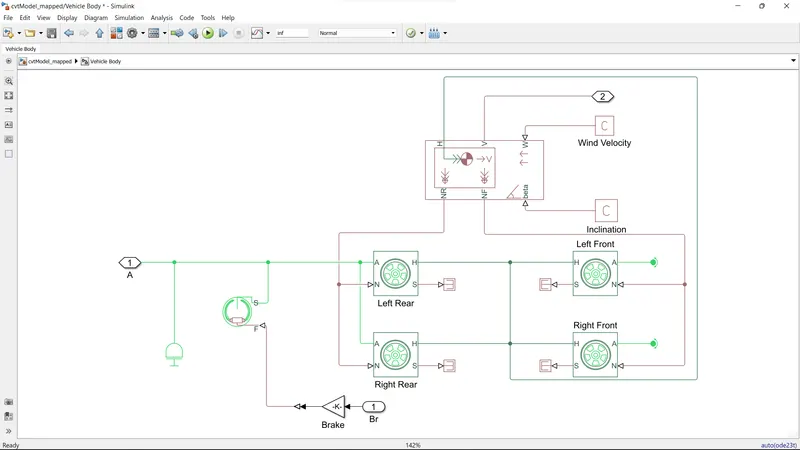
A sub-system of Vehicles body blocks (figure5):
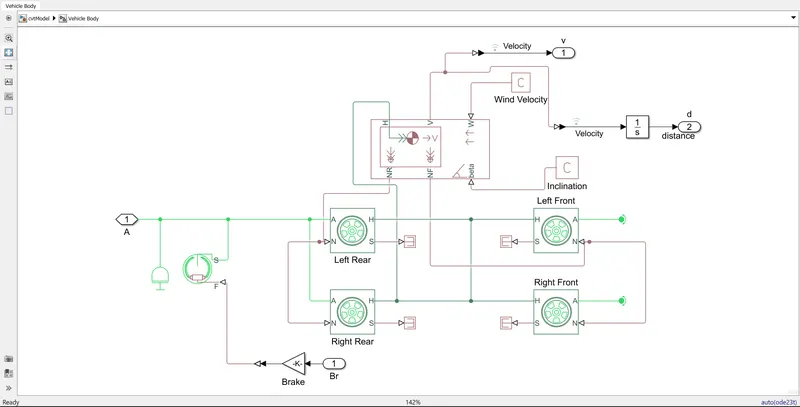
These blocks include a drum brake on all four wheels as shown in fig
Inputs Parameters :
The initial speed of an engine is set to be 1750rpm, it is driven by a pulley of driven and driver of a value 0.8,0.7 resp.
The M Mass of the vehicles is said to be 250kg with 2axles and 4wheelie.

The Signal builder blocks are used to represent the input of brake and throttle for working of the ATV model, In here I have to change the input value for my concern and for self-study too.
The value of Brake is given as 0 for an entire operation and throttle value is given as 0.5 for 20sec and drastically increased to 1 for overall simulation.
Figure 6
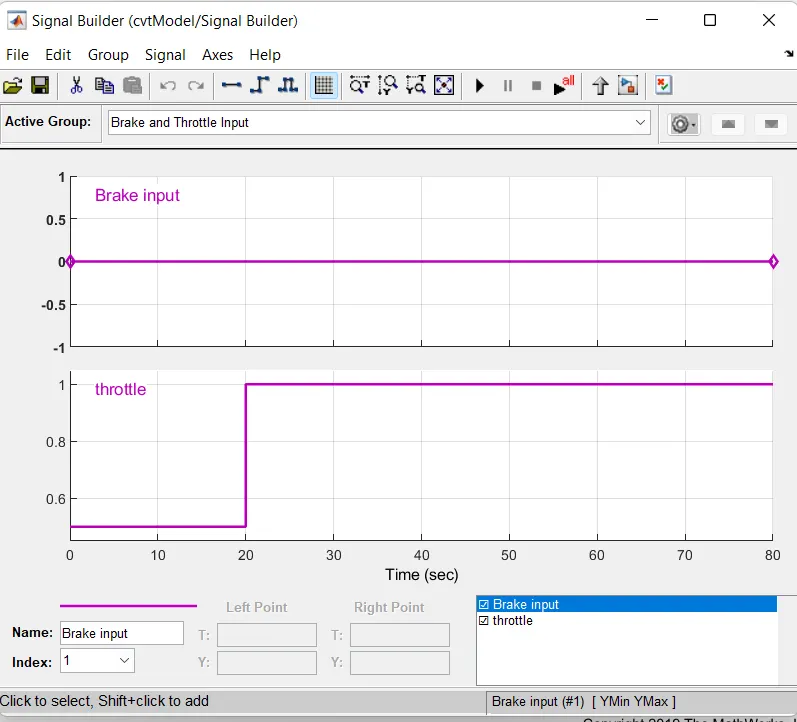
The throttle valve controls the flow of petrol ignited to an engine if the throttle increases fuel consumption also increases.
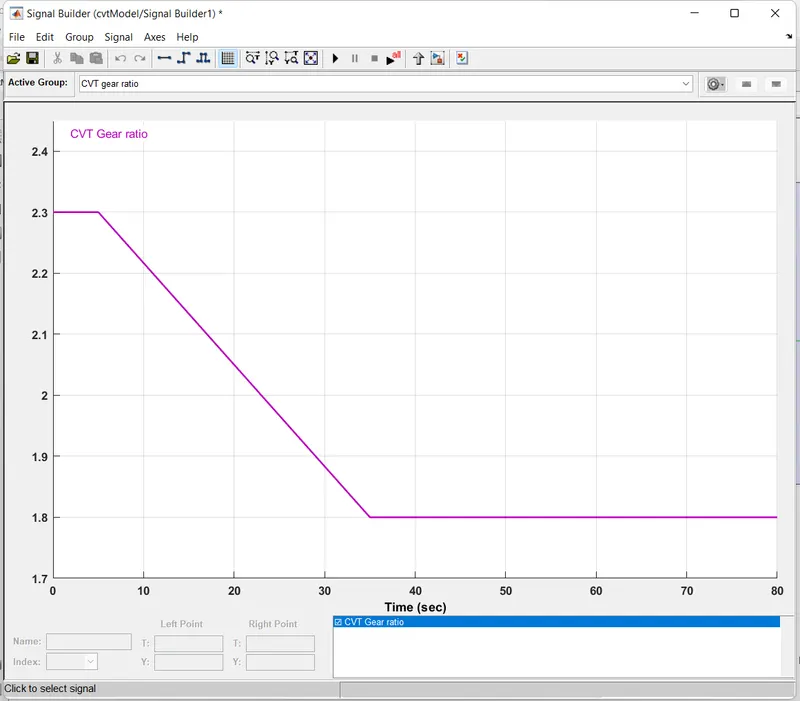
The gear ratio is maintained at 2.3 for 5secs and linearly decreased to 1.8 from 35 secs.
Figure 7
OUTPUT OF THE VEHICLE BODY AND BRAKE AND THROTTLE VALUES:
Study1: Variation of velocity & Shaft speed:
Figure 8
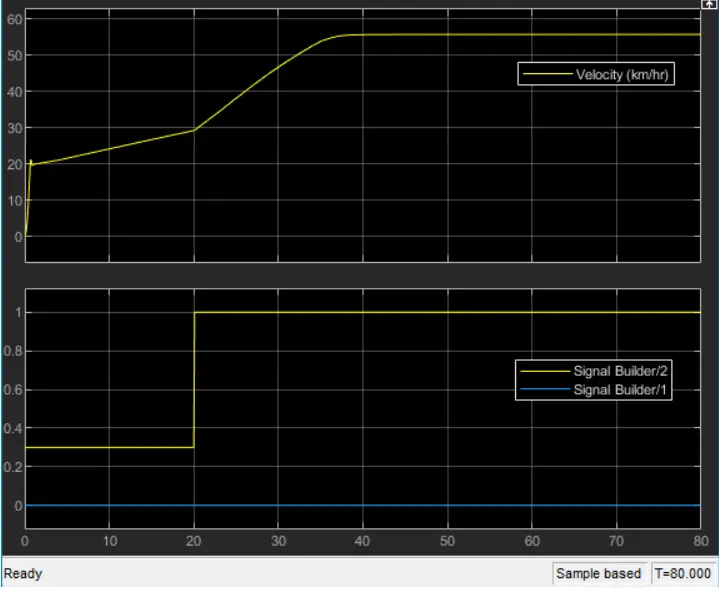
In the above figure, this is output without a dashboard here brake is maintained as constant and the throttle will increase as velocity increases.
the flow of fuel increases when a throttle increases from 0.3 to 1, so the power of an engine increases.
Where the gear ratio is directly proportional to the torque since the output of torque increases the gear ratio is also increased.
So that speed and velocity are maximum.
OUTPUT OF PRIMARY AND SECONDARY RPM:
Figure 9
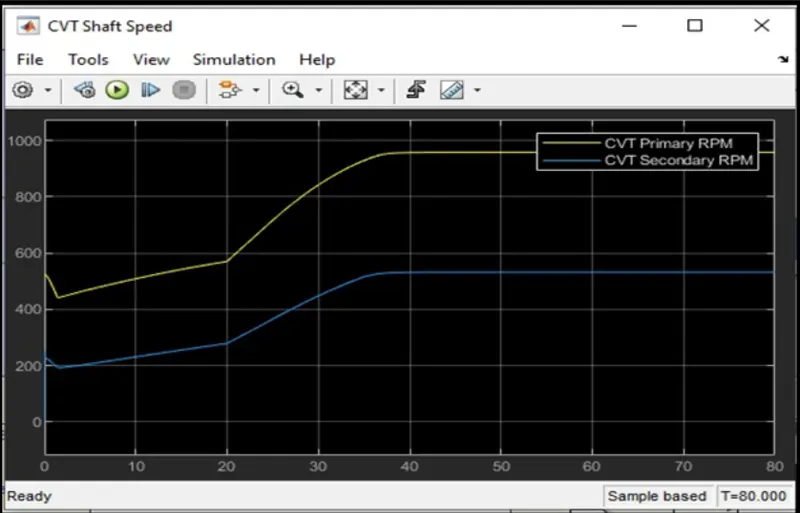
In the above figure, the primary shaft reaches high speed and the secondary shaft has low rotational speed because the radius of the primary shaft is more than the secondary shaft.
The speed is directly proportional to the radius of the shaft.
As the radius increases the speed of the shaft also increases.
Case Study 2:
Study of Baja ATV with DASHBOARD:
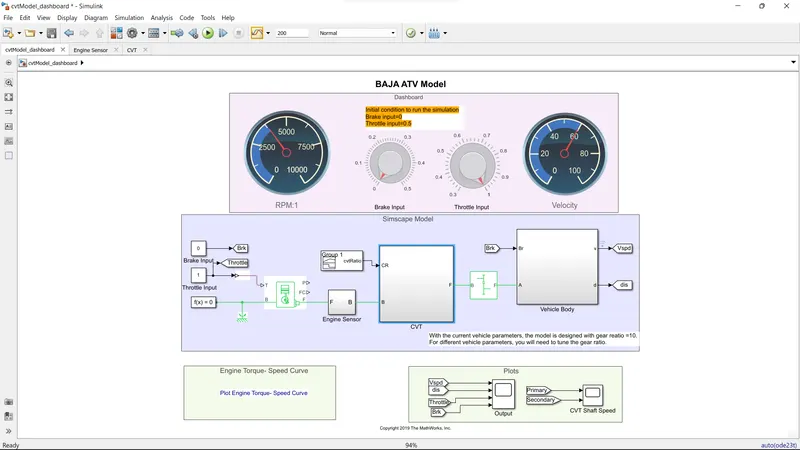
It Shows that "BAJA ATV using a lookup table with Dashboard" which consists of a Throttle meter, Brake Input meter, and a constant block.
Figure 10
In this BAJA ATV model, it consists of a signal builder, Generic engine, Engine motion sensor, vehicles transmission, Body of vehicle, Slover configuration, Gears, and more sub-system, Goto, etc.., by using the Simulink model we are going to perform the operation and to see the results.
The subsystem of this model and the above model is the same as without the dashboard model but here the value of brake and throttle values by using a constant block instead of the signal builder.
The concept of using a dashboard is to study the velocity and the engine speed.
Hear the gear ratio is maintained as given data for overall simulation as shown in the above signal builder of CVT.
Here the break input will vary from 0-0.5 so that velocity will vary according to the corresponding values.
Simentensoly the throttle value is said to be 1 for the engine and shaft speed increases.
Here the output of the CVT Engine is shown below with varying the throttle input by controlling the node by moving it by hands. Since the value varies according to it.
OUTPUT OF THE VEHICLE BODY AND BRAKE AND THROTTLE VALUES WITH DASHBOARD:
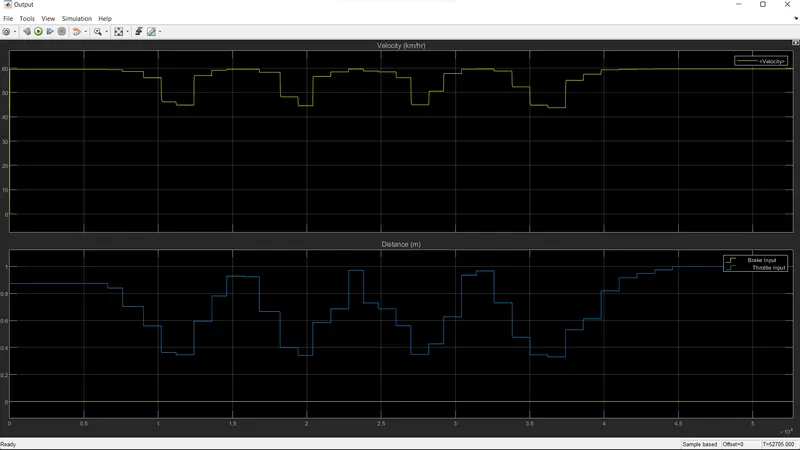
In the below figure, the velocity of the vehicle is maintained as constant for a constant throttle value of 0.5 and varies by increasing the value of throttle which increases the velocity of the vehicle.
by increasing the brake input, the velocity of the vehicle decreases accordingly to the below figure
Here if we apply the brake value during the running of the sequence then the value shows as zero.
Figure 11
OUTPUT OF PRIMARY AND SECONDARY SHAFT:
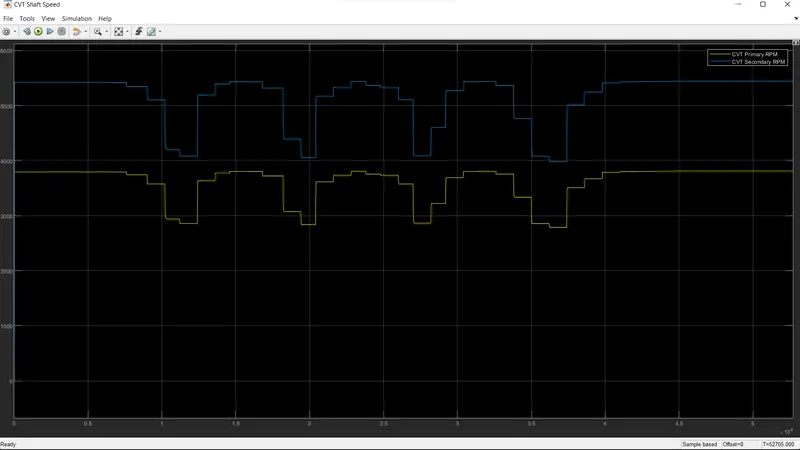
Here the primary shaft value increases as the throttle increases so that value of the shaft is been not become zero.
If we apply the brake value then the value of the primary shaft will become zero.
In the primary shaft, the fuel consumption is higher and the power of the engine is higher.
Whereas in the secondary shaft the value of fuel consumption and power of the engine is lower.
Figure 12
Case study 3:-
Study of ATV using a lookup table chart:
Here this Baja ATV model comes with a lookup table since each model comes with a different sort of variation to achieve rectify the mistake from the previous model.
Using the Simulink model of CVT is consists of a Stepup block used for brake and throttle inputs, generic engine, Motion sensors, vehicles transmission body, tyres, solver configuration, Engine sensor, Simple Gear, Goto, From, wind velocity, etc..,
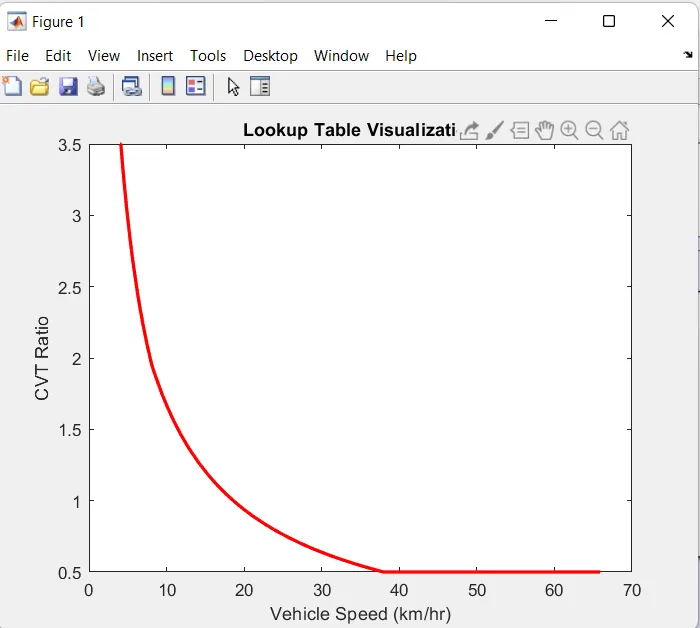
A Look-up table is an array of data that maps inputs values to output values, thereby approximating a mathematical function.
Given a set of input values, a lookup operation retrieves the corresponding output values of the tables.
If the lookup table doesn't achieve the input values, Simulink can estimate output by using the rounding, interpolation, or else extrapolation.
Figure 13
Here the value of the lookup table shows a graph of CVT ratio vs Vehicle Speed.
In the below figure if the value of the CVT ratio is higher example 3.5 at that time vehicle speed is 10km/hr gradually if the CVT gear ratio is getting lower then the value of vehicle speed increases.
@0.5 of gear ratio the speed value is said to be linear and travels to 40-68kmph.
Figure 14
Here the difference in the CVT subsystem is that the lookup table is directly connected to the variable ratio instead of connecting CR to it. and from it, the Output of the CVT value is taken and plotted out. Figure 15
A figure of Vehicle transmission:
Here this model is similar to the above transmission model though the system works similarly as common.
Figure 16
OUTPUT OF THE VEHICLE BODY AND BRAKE AND THROTTLE VALUES WITH LOOKUP TABLE:
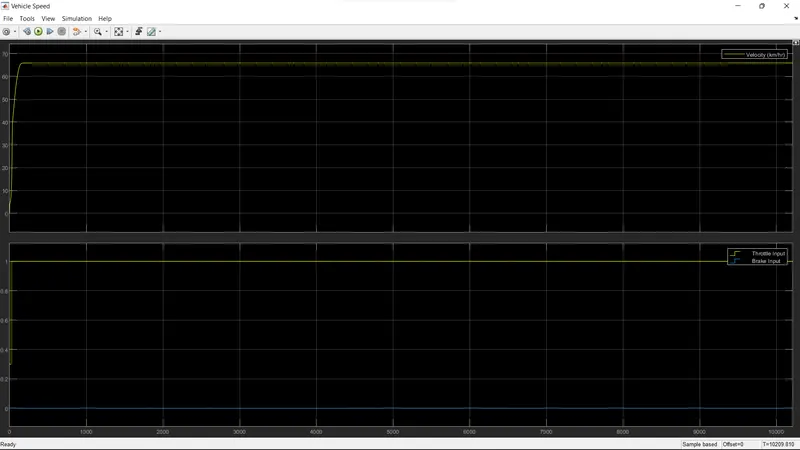
At the start of the simulation, the value of velocity is low when the Gear ratio is low but it gradually increases as the CVT gear ratio decreases though the simulation is performed for an "infinite time" so that a constant speed is attained once the value is been crossed over 65kmph.
Figure 17
OUTPUT OF PRIMARY AND SECONDARY SHAFT:
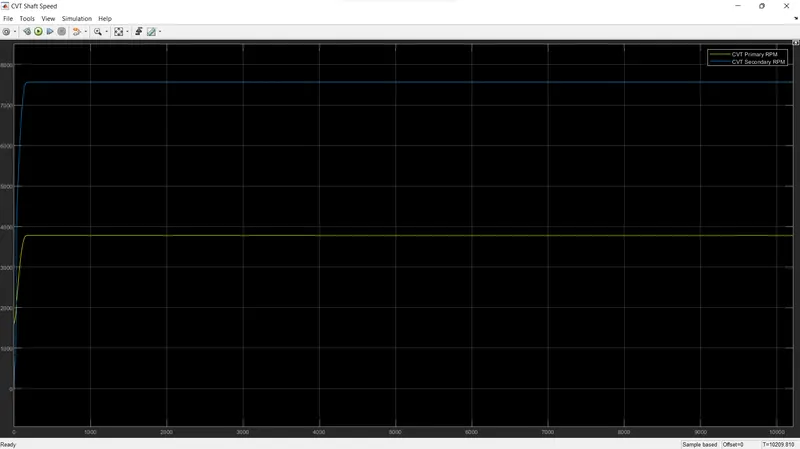
Similarly, Primary and secondary speed is also the same according to this input given.
Figure 18
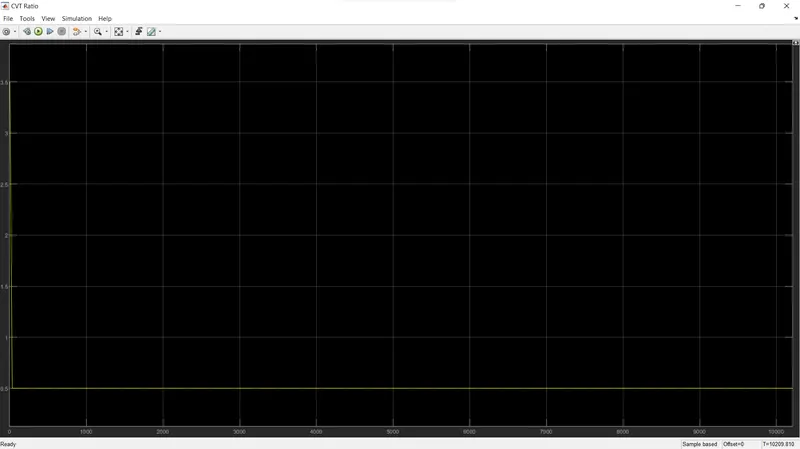
As the lookup table shows the output of the CVT ratio says it is similar output for it.
The value of the CVT ratio is higher example 3.5 at that time vehicle speed is 10km/hr gradually if the CVT gear ratio is getting lower then the value of vehicle speed increases.
@0.5 of gear ratio the speed value is said to be linear and travels to 40-68kmph.
Figure 19
Case Stuy 4:
Study of BAJA ATV model by using a Lookup table with DASHBOARD:
Figure 20
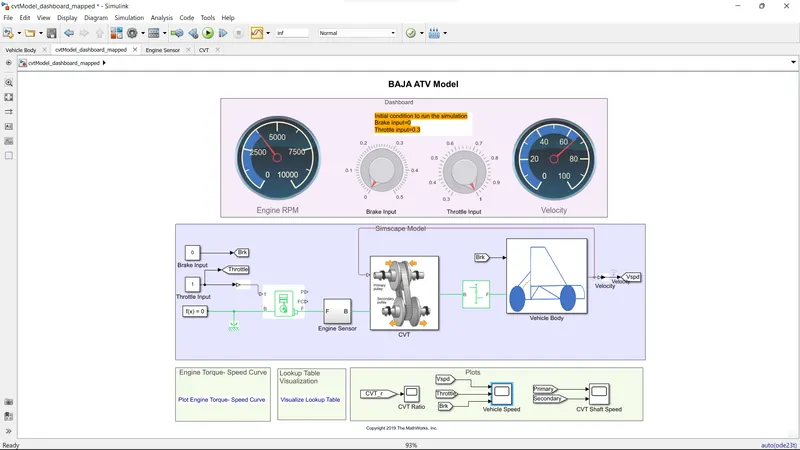
From the Above figure, It Shows that "BAJA ATV using a lookup table with Dashboard" in which consists of a Throttle meter, Brake Input meter, and a constant block.
The rest of the Blocks are the same as BAJA ATV with the lookup table in the above figure(10,15,16).
The main concept of using Dashboard is to study the output of varying input of Throttle and brake input then by using a variation of velocity and speed of the engine with using of lookup table as shown in figure 14.
As the Brake input varies from 0 to 0.5, the velocity and speed will increase or decrease by our inputs same as the gear ratio is also increases or decreases.
By increasing throttle value, the speed of the engine and shaft increases.
The transmission as a primary pulley and secondary pulley, in that radius of primary pulley increases and at same time secondary pulley radius decreases.
As the Gear ratio is directly proportional to the torque if torque decreases gear ratio also decreases.
at max range of torque-speed and velocity decreases.
OUTPUT OF THE VEHICLE BODY AND BRAKE AND THROTTLE VALUES:
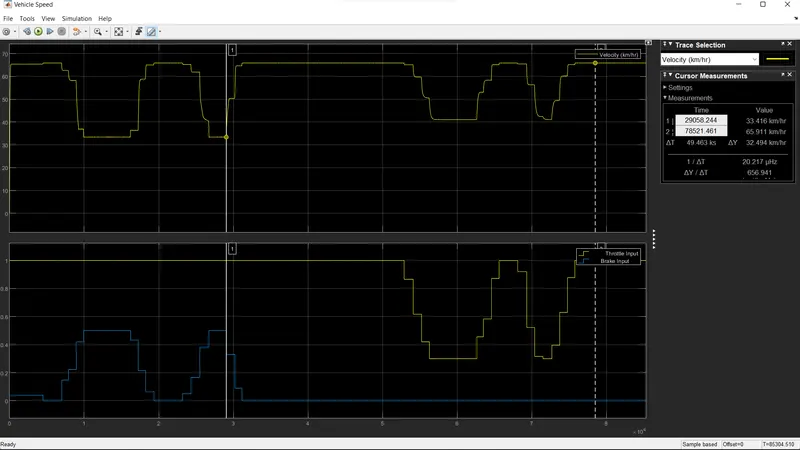
At point 1 the value of the velocity is at the minimum 33.41kmph at the time Brake input is given at the maximum point of 0.5.
Whereas At point 2 the value of the velocity is at the maximum of 65.91kmph on that point brake value is 0.3, the throttle is 1, and the velocity at the maximum speed remains constant as we haven't changed it.
Figure 21
OUTPUT OF PRIMARY AND SECONDARY SHAFT:
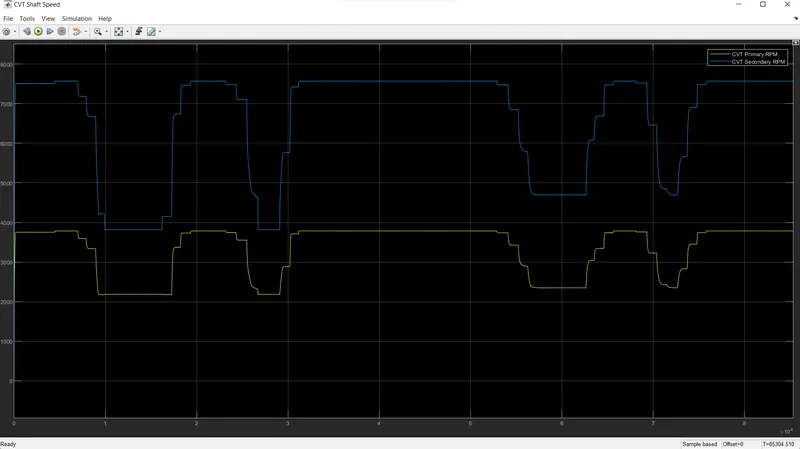
In the below figure, the primary shaft speed increases by increasing the throttle and decreasing by increasing brake input value, which defines that the throttle can flow more amount of fuel which increases the power of the engine and is similar to the secondary shaft.
The radius of the primary shaft as more than the secondary shaft, and the speed is directly proportional to the radius of the shaft.
As the radius increases the speed of the shaft also increases. The throttle value and brake input value can be varying in a dashboard, so we can get any particular value for
Conclusion:
With help of the lookup table, we can vary any input value and also get the output value by using the interpolation and extrapolation method which the Simulink can solve.
The final model is best to use in the system because it has every feature that the 3 model lacks on it and in this, it has been rectified and gave good output than the others.