Week 4.1 - Genetic Algorithm
AIM: To Generate a coding to find the Global Maixma by using Genetic Algorithm by Stalagmite Function
INTRODUTION:
Genetic Algorithm:
It is global optimization techniques used to optimize the large data for the prediction of the upcoming value by using the non-linear and non -differential equation using the concepts according to the requirements , to attent this function you have to create a stalagmite function
GA Syntax;
Explaination of GA syntax used in it.
i) Syntax for Unbounded Condition:
Where "x=ga(fun,nvars)"is used for objective function 'fun' and total no of inputs as 'nvars'. Inputs such as X and Y are enter into the program.
ii) Syntax for bounded Condition:
"x=ga(fun,nvars,[],[],[],[],lower boundary , upper boundary)"
in this lower and upper values are as per required data , the square bracket are given empty is indicated that any constriants.
iii) Syntax for Increasing GA Iterations:
"x=ga(fun,nvars,[],[],[],[],lower boundary , upper boundary,[],[],options)", it is equations for minimization to be constrained , in this population size to 200.
Programming:
%Determine the maxima of Global by using stalagmite function

clear
close all
clc

%inputs
x=linspace(0,0.6,150);
y=linspace(0,0.6,150);

%creating a 2D mesh
[xx,yy] = meshgrid(x,y);

%Inputs parameters for calculations
for i=1:length(xx)
    for j=1:length(yy)
        input_vector(1)=xx(i,j);
        input_vector(2)=yy(i,j);
        f(i,j)=stalagmite(input_vector);
    end
end

[input,fval]=ga(@stalagmite,2);
x = input(1);
y = input(2);
xlabel('xaxis')
ylabel('yaxis')

%Study_1 Unbounded Value
initial_condition = 50;

tic
for i=1:initial_condition
    [input,f1(i)]=ga(@stalagmite,2);
    x1(i)=input(1);
    y1(i)=input(2);
end
case_1_time = toc

%Plotting First Value

figure(1)
%creating subplot
subplot(2,1,1)
hold on
surf(xx,yy,f)
title('Unbounded Inputs')
%Naming the plot
xlabel('Xaxis')
ylabel('Ylabel')
zlabel('Zaxis')
shading interp
plot3(x1,y1,f1,'Marker','o','MarkerSize',5,'MarkerFaceColor','r')
subplot(2,1,2)
plot(f1)
xlabel('Iterations')
ylabel('Function Maxima')

 %Study_2 Bounded Value
 for i=1:initial_condition
     [input,f2(i)]=ga(@stalagmite,2,[],[],[],[],[0;0],[1;1]);
     x2(i)=input(1);
     y2(i)=input(2);
 end
 case_2_time = toc

%plotting Second Value
figure(2)
subplot(2,1,1)
hold on
title('Bounded value')
surf(xx,yy,f)
shading interp
plot3(x2,y2,f2,'Marker','o','Markersize',5,'markerfacecolor','r')
%Naming the axis
xlabel('Xaxis')
ylabel('Yaxis')
zlabel('Zaxis')
subplot(2,1,2)
plot(f2)
xlabel('Iteration')
ylabel('Function Maxima')


%Study_3 Increasing of GA population
options=optimoptions('ga');
options=optimoptions(options,'populationSize',200);

tic
for i=1:initial_condition
    [inputs,f3(i)]=ga(@stalagmite,2,[],[],[],[],[0;0],[1;1],[],[],options);
    x3(i)=input(1);
    y3(i)=input(2);
end


Cases_3_time = toc

%plotting
figure(3)
subplot(2,1,1)
hold on
title('Standard increase value of GA')
surf(xx,yy,f)
shading interp
plot3(x3,y3,f3,'Marker','o','Markersize',5,'markerfacecolor','r')
xlabel('Xaxis')
ylabel('Yaxis')
zlabel('Zaxis')
subplot(2,1,2)
plot(f3)
xlabel('Iteration')
ylabel('Function Maxima')
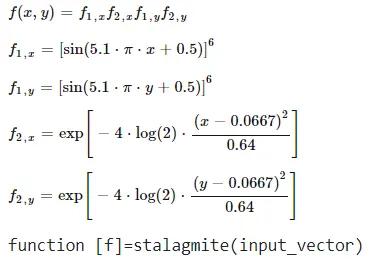
Function of Stalagmite is generated by using the formula which is shown in the video.
function A=stalagmite(input_vector);
          x=input_vector(1);
          y=input_vector(2);
          f1=(sin(5.1*pi*x+0.5)).^6;
          f2=exp((-4.*log(2)*((x-0.0667).^2))/0.64);
          f3=(sin(5.1*pi*y+0.5)).^6;
          f4=exp((-4.*log(2)*((y-0.0667).^2))/0.64);

 A= -(f1.*f2.*f3.*f4);

end
Explanation of Codes:
Step1:Basic inputs such as clear , close all , clc commands are used
Step2: Inputs of the function x, y are given by using linspace(x,y,n)
where n is no of iterations.
Step3: Creating a mesh by using meshgrid of xx,yy.
Step4: Giving the input parameter value as per the function to compute the funtion of stalagmite.
Step5: Then calling the value of Stalagmite and labeling it.
Step6: In this we have to code for three diffferent studies
Step7: Study 1 is Unbounded condition for this initial condition is given as 50. For each study giving the suitable title and by using marker,markersize, markerfacecolor plot is been created.
Step8: Calling the function again for generate the result and then creating the figure for the output by using "Subplot" commands where Shading interp is used and then labelling the value of xaxis and yaxis for case_1.
Step9: For each study giving the suitable title and by using marker,markersize, markerfacecolor plot is been created.
Step10: Study 2 is Bounded Value condition for this initial condition is also set to 50.
Step11: The input value for study 2 is different because here i add some empty brackets to obtain the value as per bounded condition
Step12: Calling the function again for generate the result and then creating the figure for the output by using "Subplot" commands where Shading interp is used and then labelling the value of xaxis and yaxis for case_2
Step13: For each study giving the suitable title and by using marker,markersize, markerfacecolor plot is been created.
Step14: Study 3 is Increaing the value of GA where the population sixze is set to 200 in this case.
Step15:Calling the function again for generate the result and then creating the figure for the output by using "Subplot" commands where Shading interp is used and then labelling the value of xaxis and yaxis for case_3
Step16: For each study giving the suitable title and by using marker,markersize, markerfacecolor plot is been created.
Step17: For each set of cases "tic" and "toc" commands is used to calculate the timing for each set.
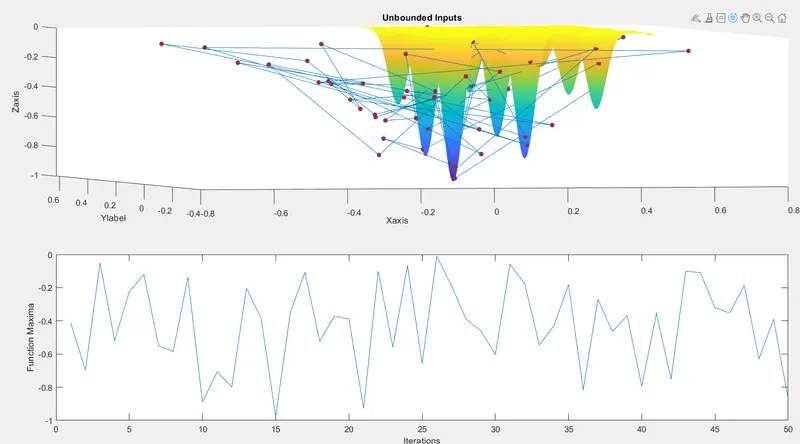
Study1: In this study the GA function is called normally with only by the given iterations. The Figure is attached for this study1.
Study2:
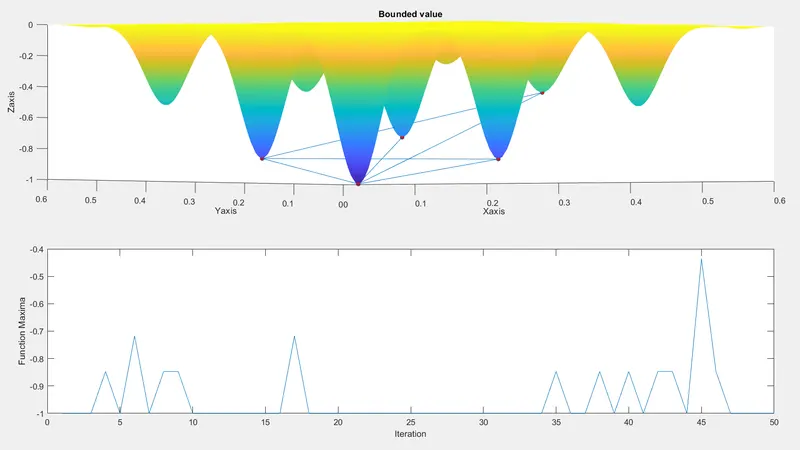
In this study the GA function is given for lower and upper bound for better results. The Figure is attached for this study2.
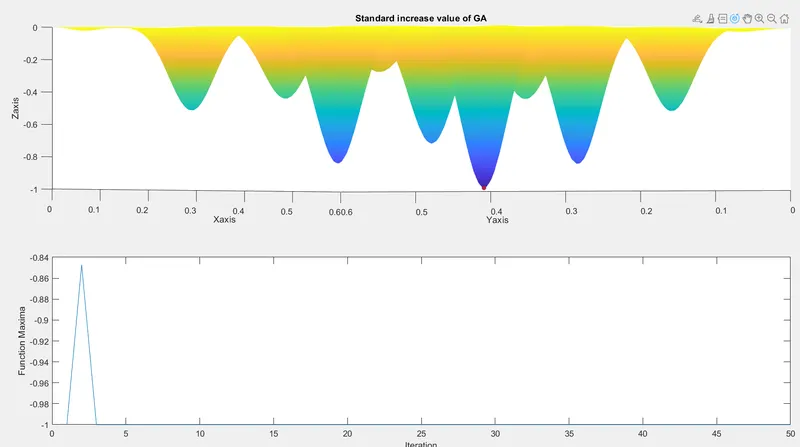
Study3: In this study the GA function is been given by the population as 200 to get better results then study 2 . The Figure is attached for this study 3.
Workspace value:
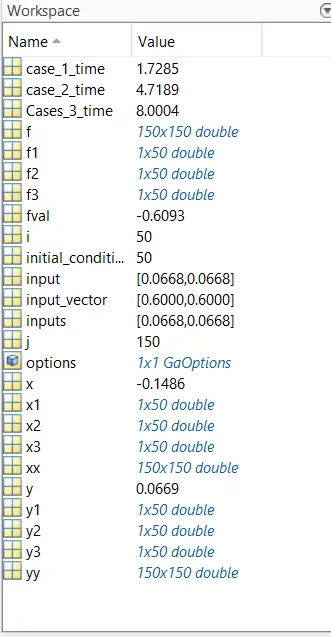
Errors: i) The error occured only the function of stalagmite is f is given in positive value so that global maxima is occured in upside , then i rectified the mistake corrected the function into negative term.
ii) Each time if i enter to run the program the value of the results changes.
Conclusion: Here the value of Global maxima is attent into three different study for a better results among the following.