Project
AIM:
To carry out a system level simulation of all terrian vehicle and to perpare a techiniacal report explaining the model properties & comments on the result
Baja all terraine vehicle (ATV) model:
-All terrain vehicle are most usefull to drive in any conditions like land, snow, ice etc.. its body structuer and the chases are specially designed to travel in any worst conditions.
-The rider sit on and operates the vehicle, there are different ridding modes according to the conditon of the terrain. The suspension and the tyres are specially designed. This vehicles really different to drive while comparing with normal vehicle.
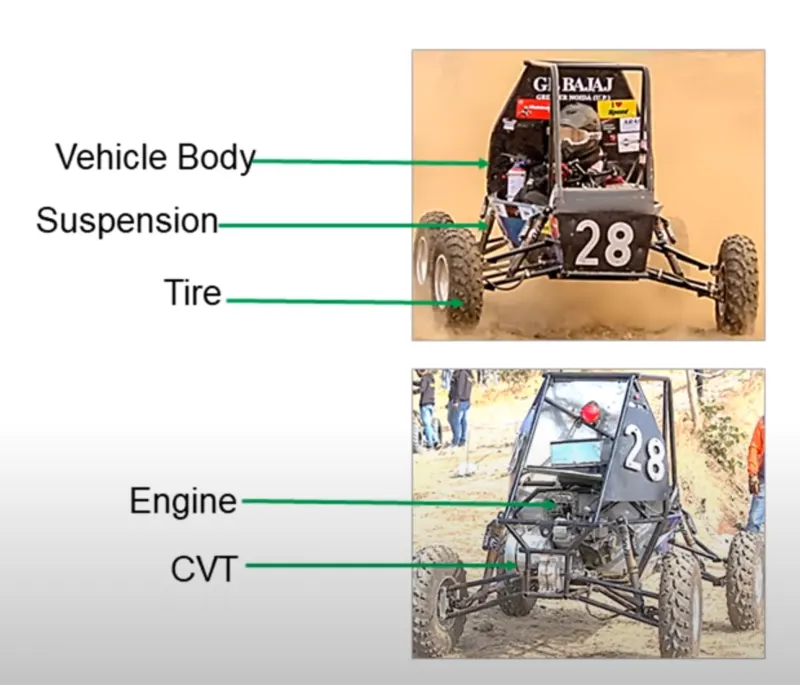
Main Components of Baja vehicle:
-vehicle Body
-supension
-Tyer
-Engine
-CVT (continously variable transmission)
CVT (Continously Variable Transmisson)
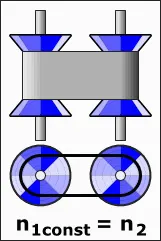
It is an automatic transmission system that can change seamlessly through a continuous range of gear ratio, this constrasts with other transmission that provide a limited number of gears. The felxibility of a CVT with suitable control may allow the engine to operate at a constant RPM while vehicle moves at varying speed.
1. Study
Case 1
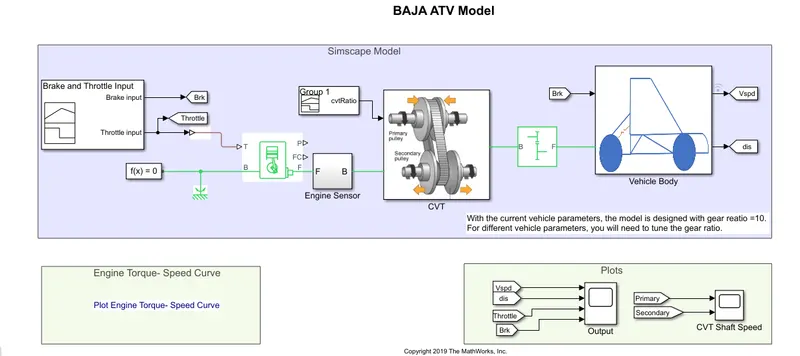
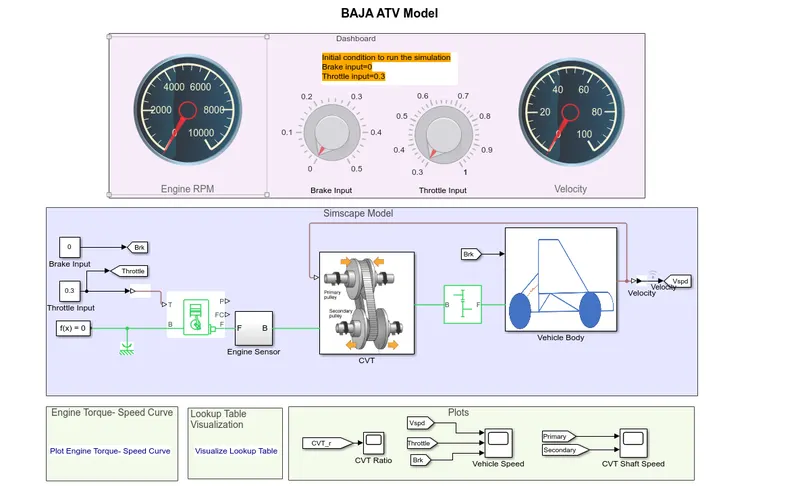
Simulink model for baja all terrain vehicle with CVT
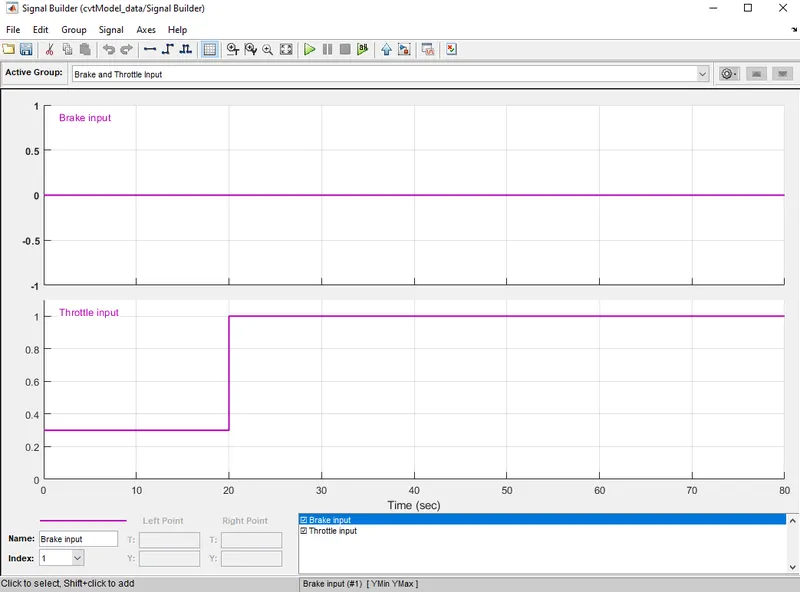
Signal builder:
Here there are two main inputs given (brake and throttle input), all this are connected with generic engine block
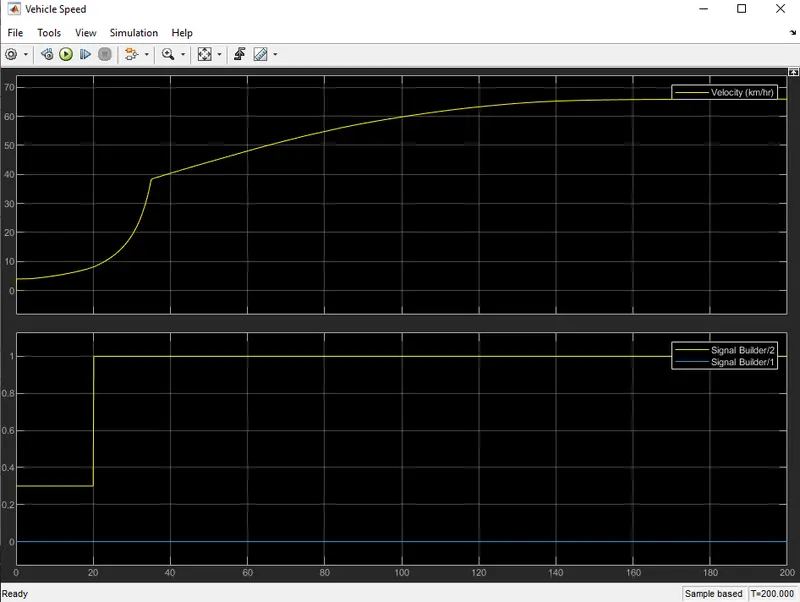
Brake input= 0, Throttle input = 0.3 for first 20 sec and 1 for remaining sec
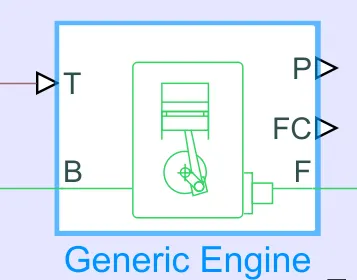
Generic engine
-A system-level model of spark-ignition and diesel engines suitable for use at initial stages of modeling with the avaliablity of basic paramaaters. Here the idle speed and red line controlles are there.
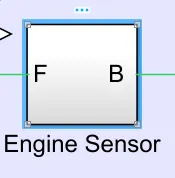
-Here F & B represents mechanical rotational cnoserving ports associated with engine crankshaft and engine block respectively
-P & FC are physical signal output ports through which engine power and fuel consumption rate are reported.
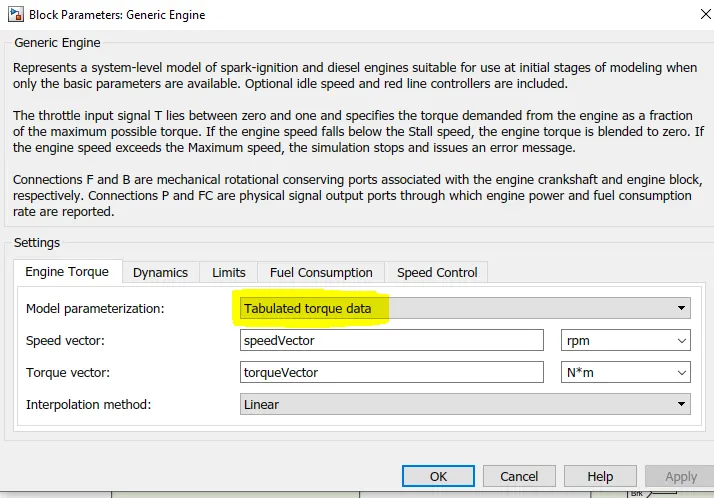
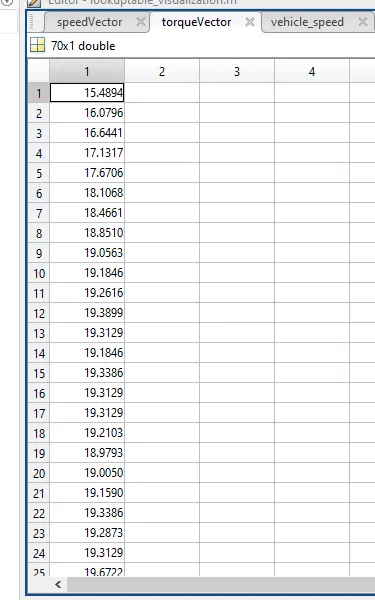
-For the model parameterization the input is given as (tabulated torque data)
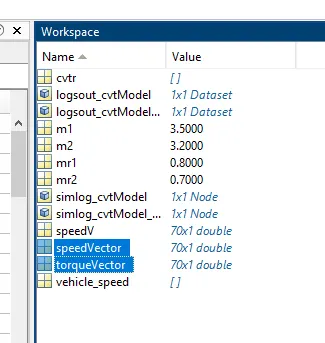
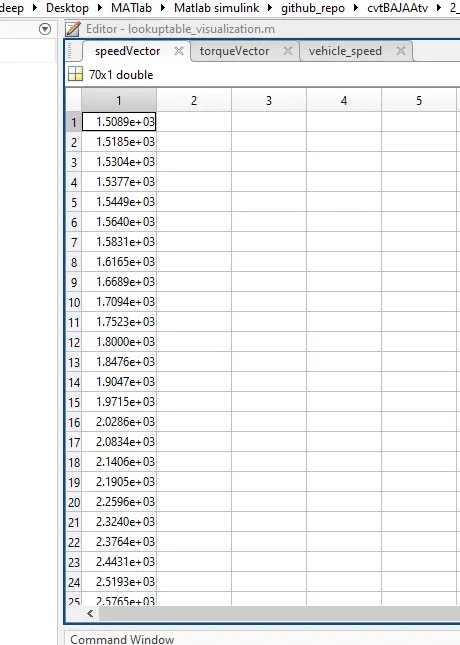
-The torqevector and speedVector values are assigned in the Matlab program (as array sets)
Engine sensor:
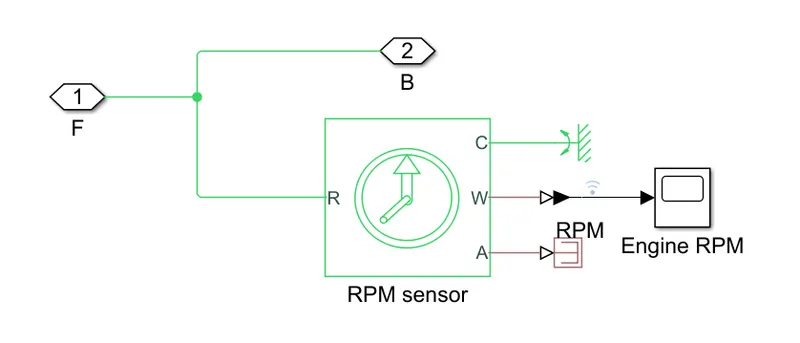
-Inner the mask, it has RPM sensor which is ideal Mechanical Rotational Sensor that converts an across variable measured between two mechanical rotational nodes into a control signal proportional to angular velocity or angle.
-R and C are mechanical rotational conserving ports and connections W and A are physical signal output ports for velocity and angular displacement, respectively. which is connected to the scope.
Continously variable transmission (CVT)
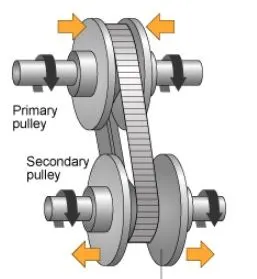
The main components are (Primary Pulley, Secondary Pulley, Variator and belt)
There are two conditions
-If Variator of Primary Pulley goes outward and Secondary pulley goes inward it will leads to Speed Reduction.
-If Variator of Primary Pulley goes inward and Secondary Pulley goes Outward it will leads to Overdrive.
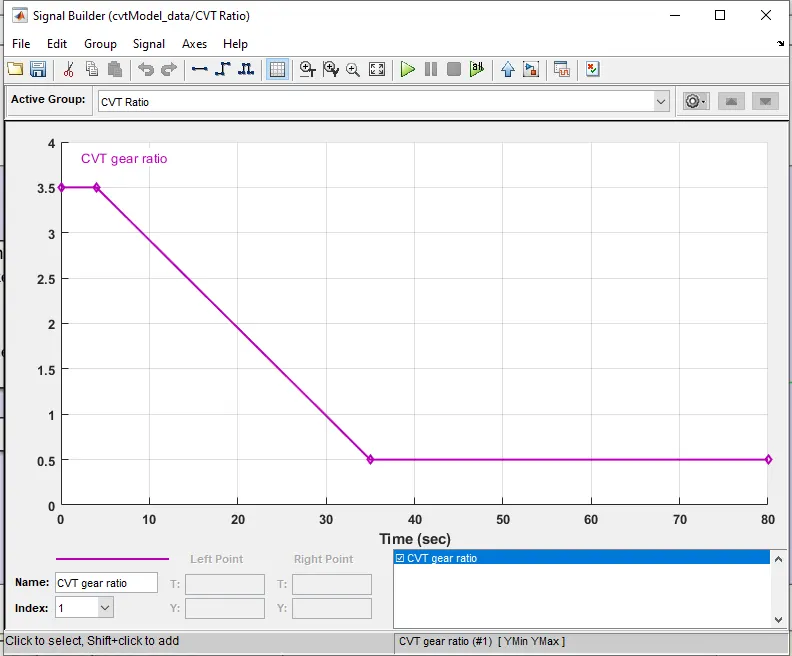
For the CVT input, signal builder is used, has mentioned below.
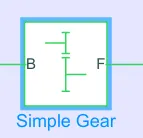
Simple Gear:
Represents a fixed-ratio gear or gear box. No inertia or compliance is modeled in this block.
You can optionally include gear meshing, backlash, and viscous bearing losses. Connections B (base) and F (follower) are mechanical rotational conserving ports.
Specify the relation between base and follower rotation directions with the Output shaft rotates parameter. Optionally include thermal effects and expose thermal conserving port H by setting Friction model to a temperature-dependent setting.
Vehicle Body:
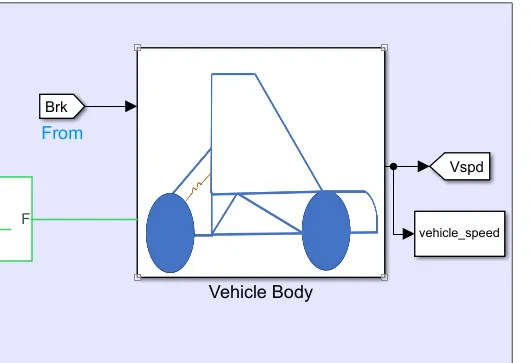
-It represents a two-axle vehicle body in longitudinal motion. Body mass, aerodynamic drag, road incline and weight distribution between axles due to acceleration and road profile.
-The vehicle can have the same or a different number of wheels on each axle. Optionally include pitch and suspension dynamics or additional variable mass and inertia.
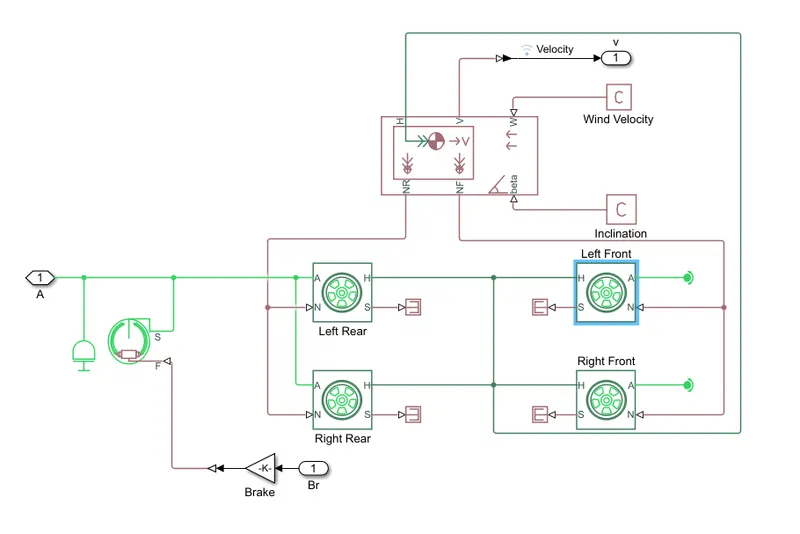
Here the wheels are connected to the brakes and inertia output of the shaft. The wheel are not specially modifed in this model.
Case 2:
Simulink model for Baja all terrain vehicle with CVT using Dashbord:
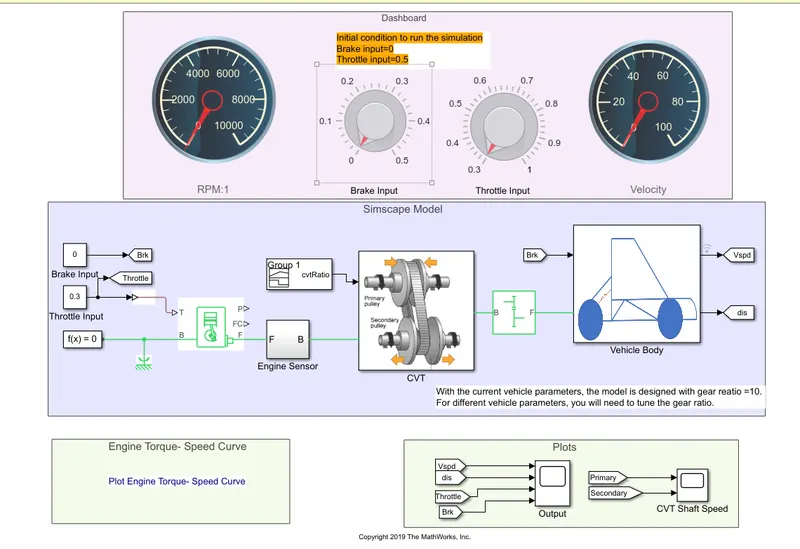
In the Above Simulink Model, RPM(Speed) gauge,Brake Input gauge,Throttle Input gauge and Velocity gauge is Connected in the dash board. Brake input is 0, Throttle input is 0.3 for Initial Condition to run the Simulation. Dashboard is connected with BAJA All terrain Vechicle using CVT in Simulink Model.
Dashboard used to identify speed variation and Velocity will display in the RPM 1 and Velocity gauge, while running the Simulation. RPM 1 gauge refers the Speed of the Primary & Secondary Pulley and Velocity gauge refers the vehicle Speed. Hence it clearly identifies the RPM and velocity according to the throttle input given.
2. Study
Case 1:
Simulink model for Baja all terrain vehicle with CVT using (lookup table)
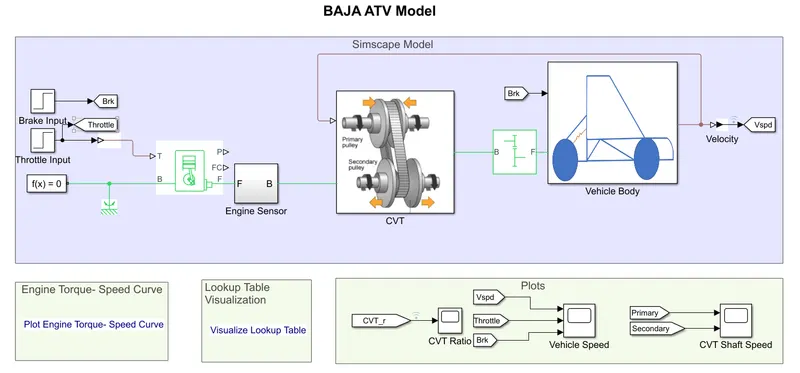
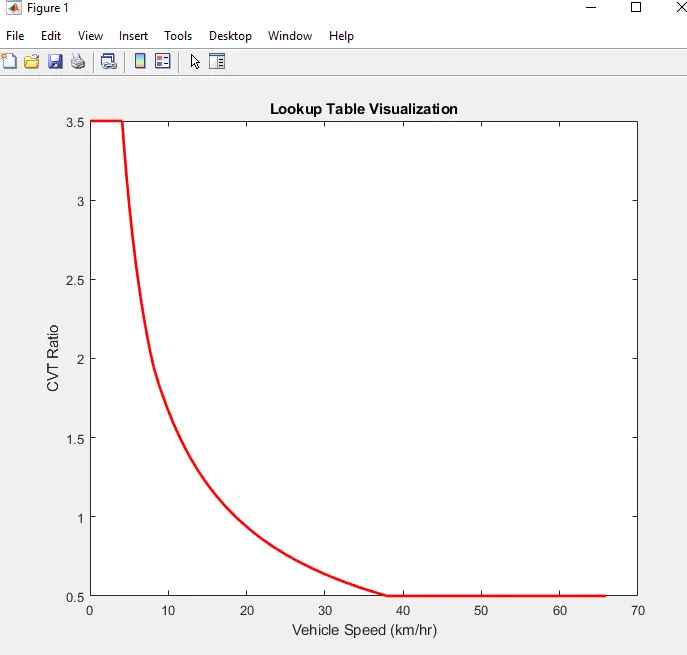
Model Look Up table data has been assigned as input to the CVT instead of CVT ratio. Input of Look up table by creating a program in the MATLAB and Data has been assigned as input to the CVT.
Look up Table visualization as Matlab CODE
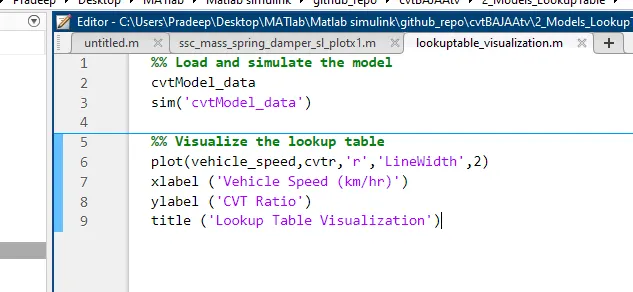
Input given to CVT using lookup table, the referance image is mentioned below,
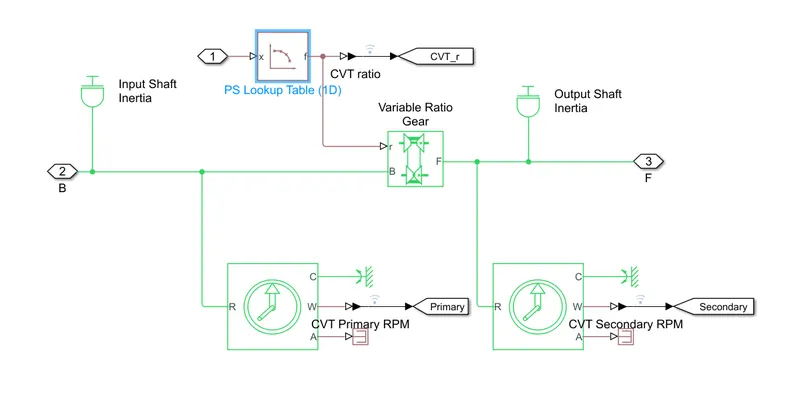
Case 2:
Simulink model for Baja all terrain vehicle with CVT using Dashboard (with lookup table)
-Here RPM ,Brake,Throttle Input and Velocity gauge are Connected in the dash board.
-The conditions are same Brake input is 0, Throttle input is 0.3 for Initial Condition to run the Simulation and the Look Up table data has been assigned as input to the CVT instead of giving cvt ratio. For Giving input of Look up table by creating a program in the MATLAB and Data has been assigned as an input to CVT and the rest of the systems.
Results:
1. Study
Case 1
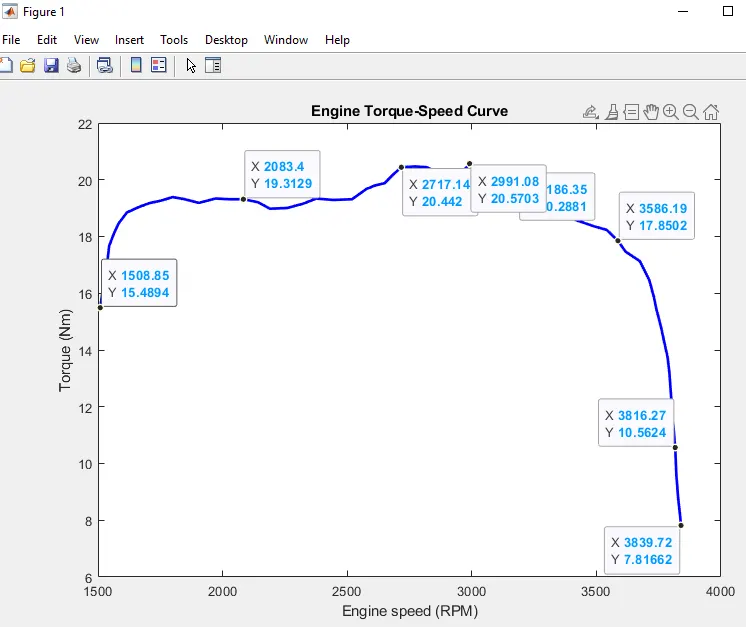
Plot engine torque speed curve and the below curve represents max velocity reaches at 3840 RPM. vehicle speed is depends on CVT ratio
Vehicle speed plot:
Initially the brake Input is 0 and throttle Input is 0.3 for 20 sec, Velocity will reach 20 and increasing the throttle input value to 1, simultaneously velocity value will increase (reaches the max)
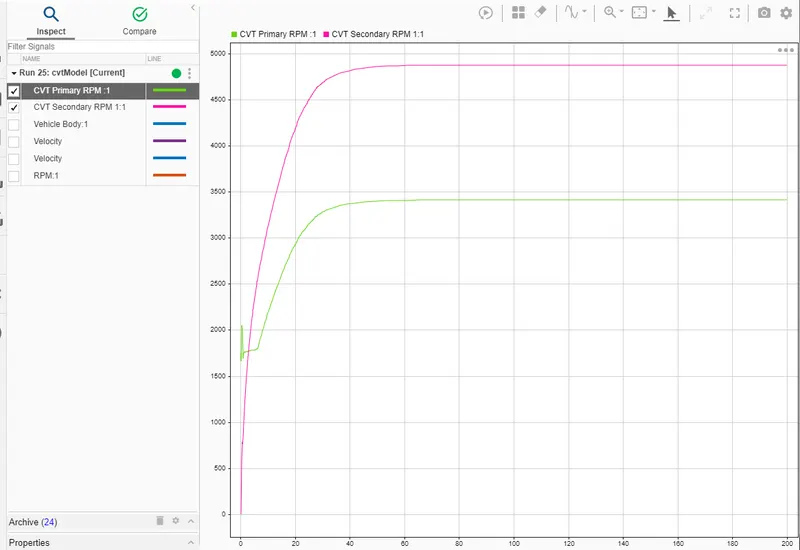
CVT primary vs secondary by data inspector:
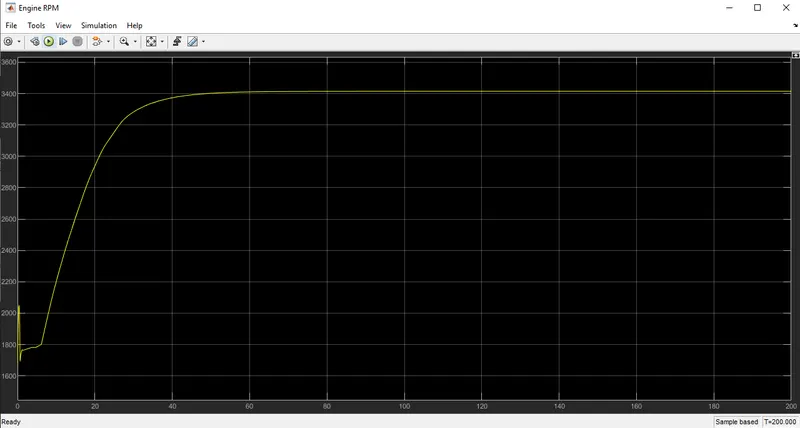
Engine RPM:
Here the Brake Input is 0 and Throttle Input is 0.3 for 20 sec , Engine Speed will decrease at the begining because of increasing gear ratio which increases the torque and by increasing the Throttle input value to 1, Engine Speed value will increase
and it obtains max speed.
Case 2
In Initial Condition RPM:1 gauge shows 0 RPM and Velocity gauge shows 0 km/hr.
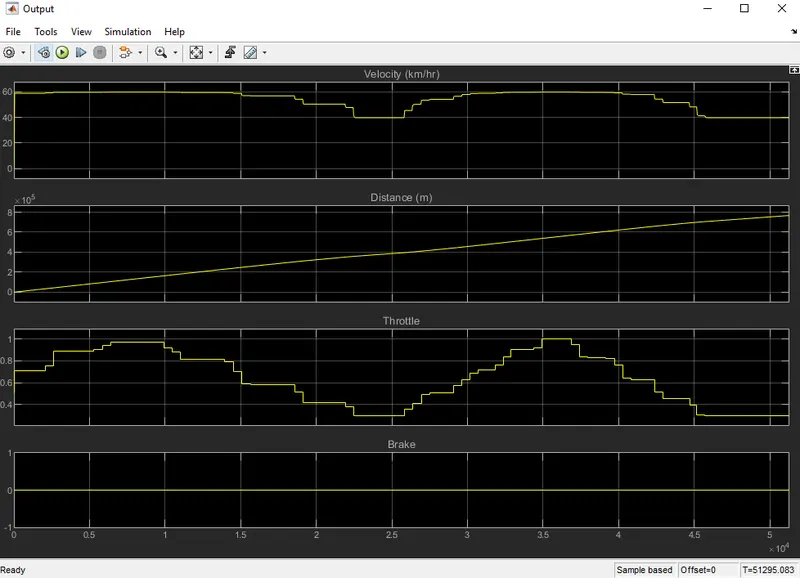
Here the time is consider as infinity(inf), While simulation is running, throttle input value & Brake Input Value kept constant (assumed without applying brake) in Throttle input gauge & Brake Input gauge in the dashboard (shown as constant line in the below graph) and will analyse the variation of RPM and velocity in the RPM gauge and Velocity Gauge.
Output graph of distance velocity brake (my self assumed by keeping it constant) and throttle (varied)
From the above Vehicle Speed plot, Observed that by increasing the throttle input value , it will increase the Velocity and by keeping the brake input value constant.
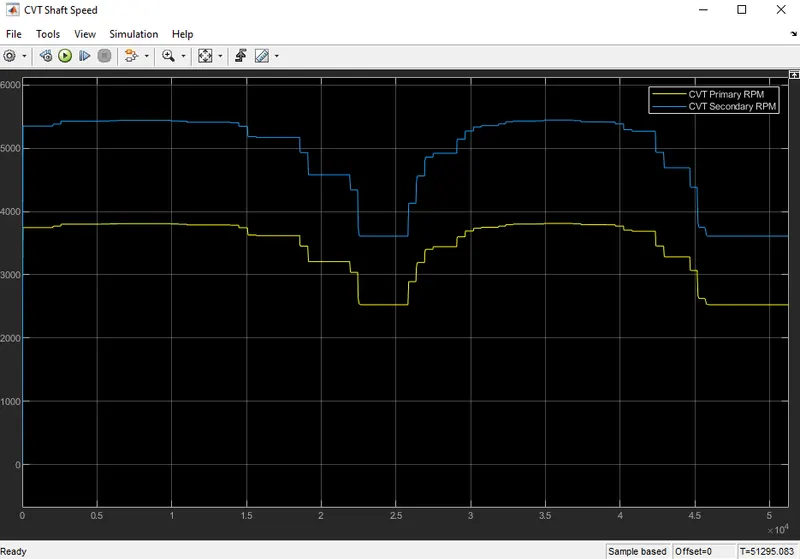
CVT shaft output:
CVT Shaft Speed plot, Observed that by increasing the throttle input value, it will increase the RPM of the Primary & Secondary Pulley and by keeping the brake as constant (not applied) own condition.
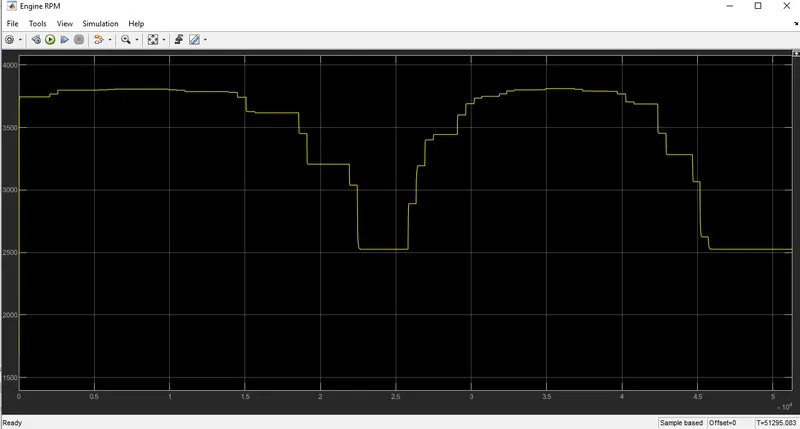
Engine RPM:
Engine Speed plot, Observed that by increasing the throttle input value, it will increase the Engine Speed.
2. Study
Case 1:
look up table visualization plot
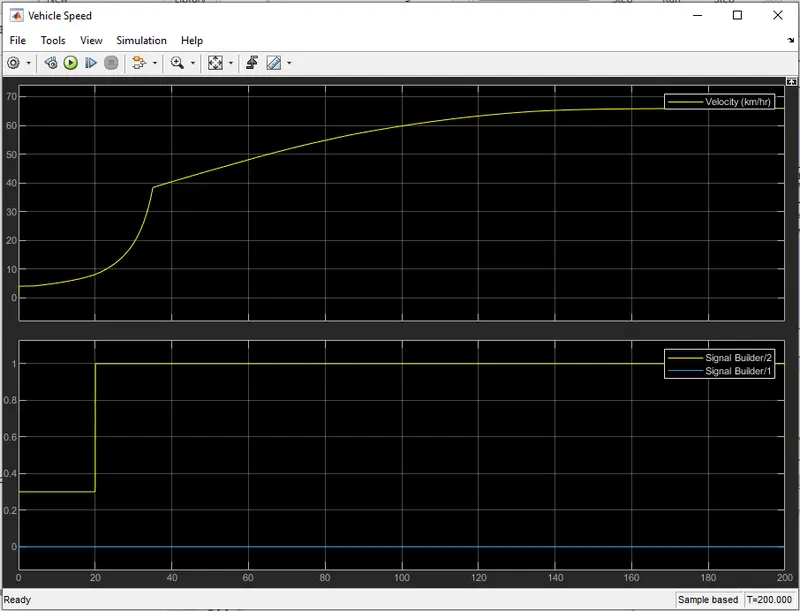
Vehicle speed plot:
Throttle Input is 0.3 for 20 sec Velocity will reach 20 and by increasing the Throttle input value to 1, then velocity value will increase and it reaches the maximum velocity.
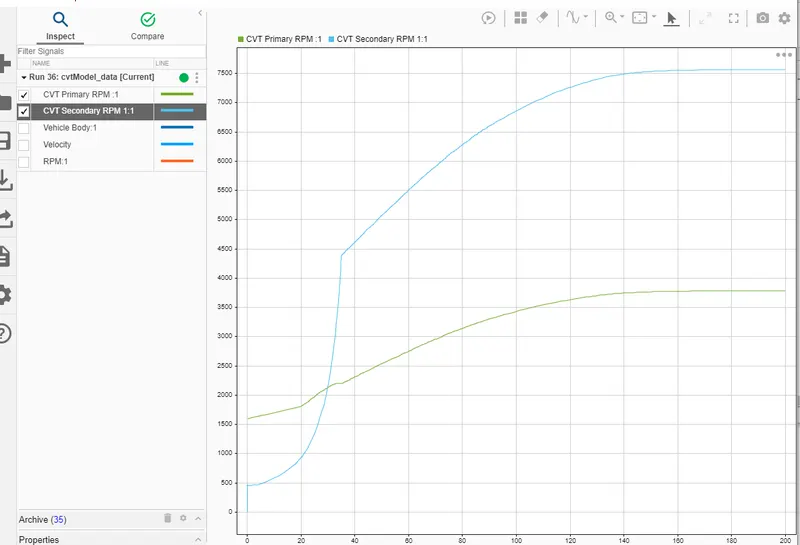
CVT primary and secondary RPM input by data inspector
Engine RPM graph:
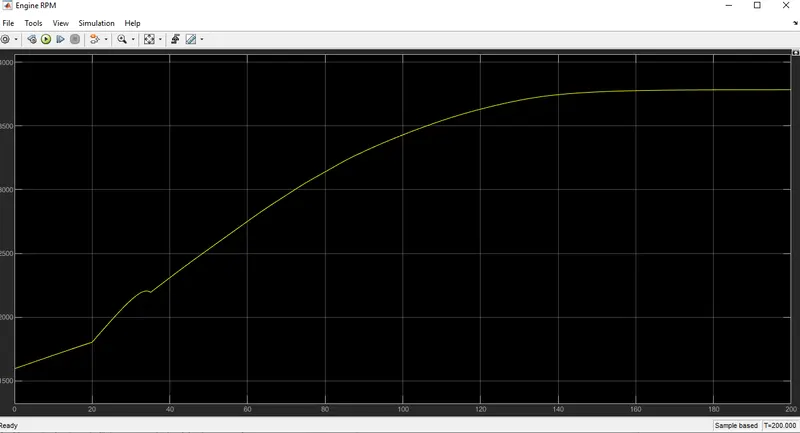
In the above Plot, Brake Input is 0 (initially assumed condition) and Throttle Input is 0.3 for 20 sec , Engine Speed will decrease at the begining because of increasing gear ratio which increases the torque and by increasing the Throttle input value to 1, then Engine Speed value will increase and it reaches the maximum Speed.
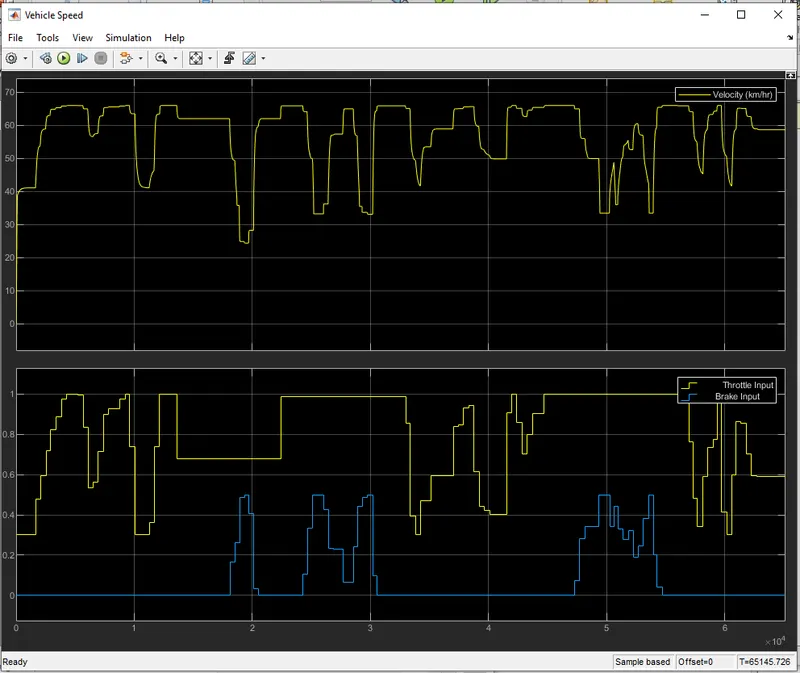
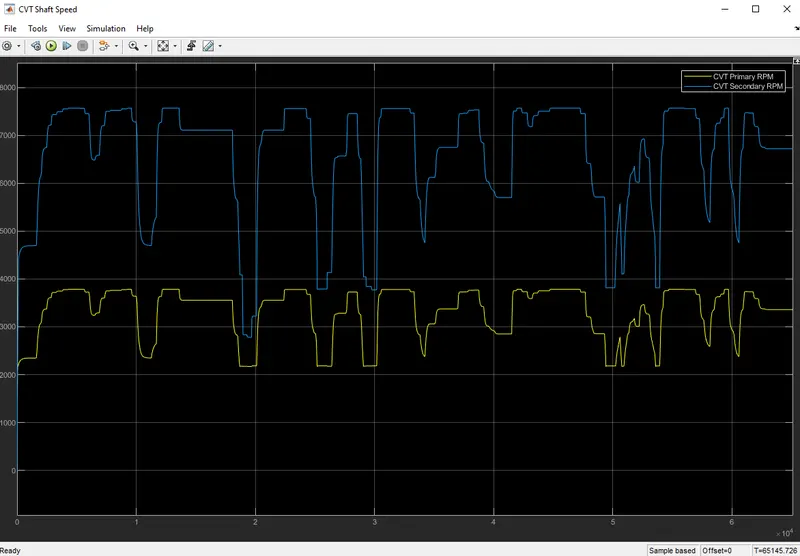
Case 2: (In this case i changed the throttle input and brake input randomly)
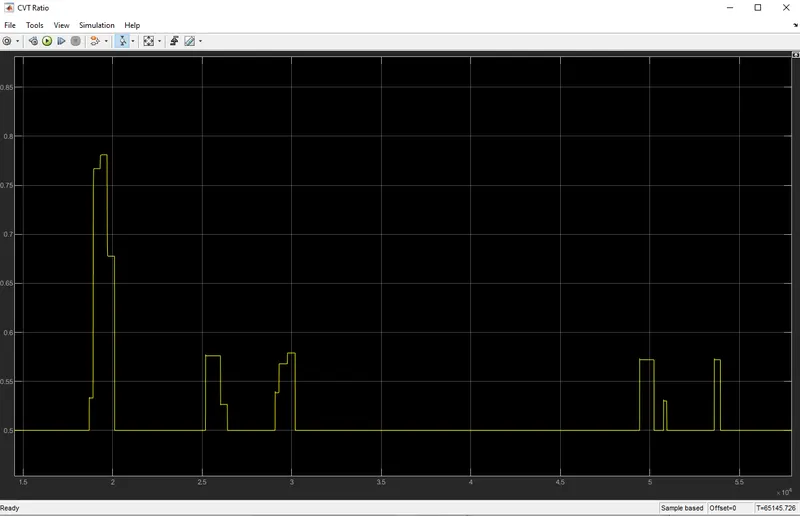
CVT ratio plot (look up table data):
Here the CVT Ratio will vary by changing the Throttle gauge. If Throttle value increases CVT ratio decreases. If Throttle value decreases CVT Ratio increases.
Vehicle speed plot:
Here the Vehicle Speed plot, Observed that by increasing the throttle input value,it will increase the Velocity and by increasing the brake input value it will decrease the Velocity.
CVT shaft speed plot
Here the CVT Shaft Speed plot, Observed that by increasing the throttle input value,it will increase the RPM of the Primary & Secondary Pulley and by increasing the brake input value it will decrease the RPM of the Primary & Secondary Pulley.
Conclusion:
Thus the System level Simulation of an BAJA All terrain vehicle Without and with Look Up Table has been done and technical report for the model has been prepared with the Output results in the form of graph (We have studied how the vehicle performs under different contitions, also the claculation of different in speed of the vehicle, also able to observe the different braking and throttle system)
Referance:
The referance link is taken from the question given, also the model is downloaded for the same given link(and i have also attched the downloaded model just for referance).