Project 1 - Parsing NASA thermodynamic data
Aim:
-To parse the NASA Theromobynamic date file and to calculate thermodynamics properties of various gas species.
Objective:
1. Write a function that extracts 14 coefficient and calulate [Enthalpy (H), Entropy (S), and Specific heat (Cp) for the given data
Formula used:

Where,
- H= U+ PV (U is internal energy, P is pressure & V is Volume)
-Enthalpy (H) of a thermodynamics system is define as the sum of its internal energy and the work required to achive its pressure and volume
- S= (a1lnT + a2lnT + a3 T^2/2 + a4 T^3/3 + a5 T^4/4 + a7)R
-Entropy (S) is an extensive property of thermodynamics. the entropy of an objective is a mesure of amount of energy which unavaliable to do work
- Cp= (a1+a2T+a3T^2+a4T^3+a5T^4)R
-The specific heat (Cp) is the amount of heat is required to raise the temperature by one degree celsius, it is a thermodynamics property
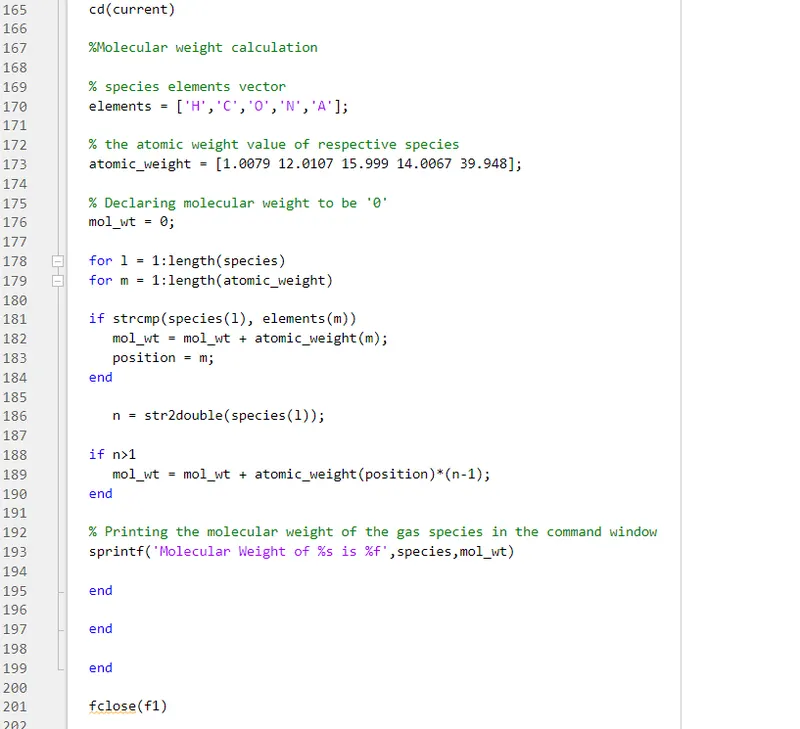
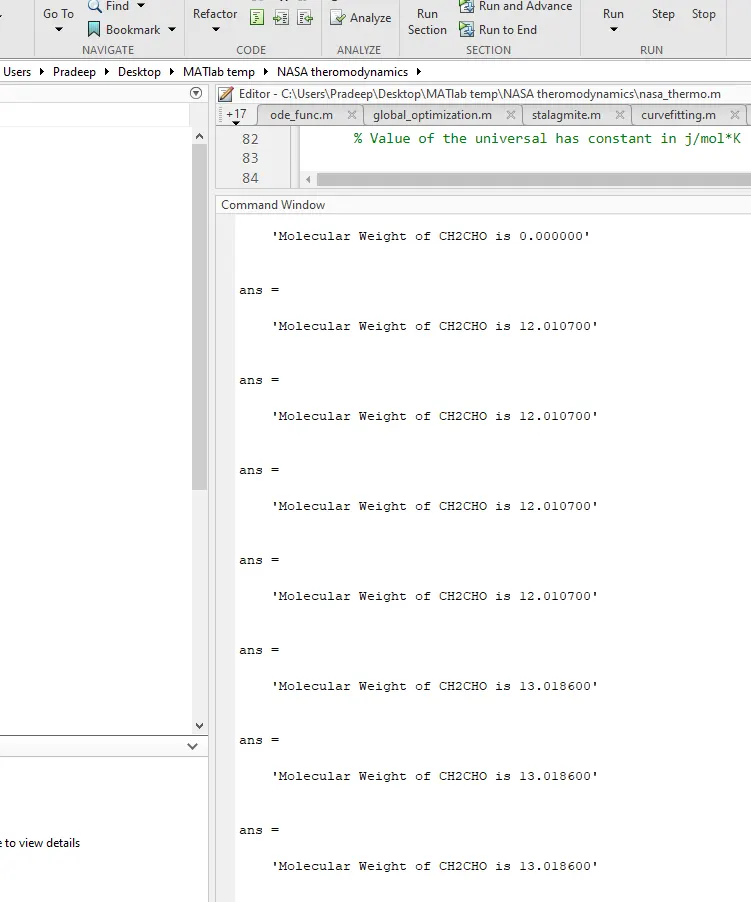
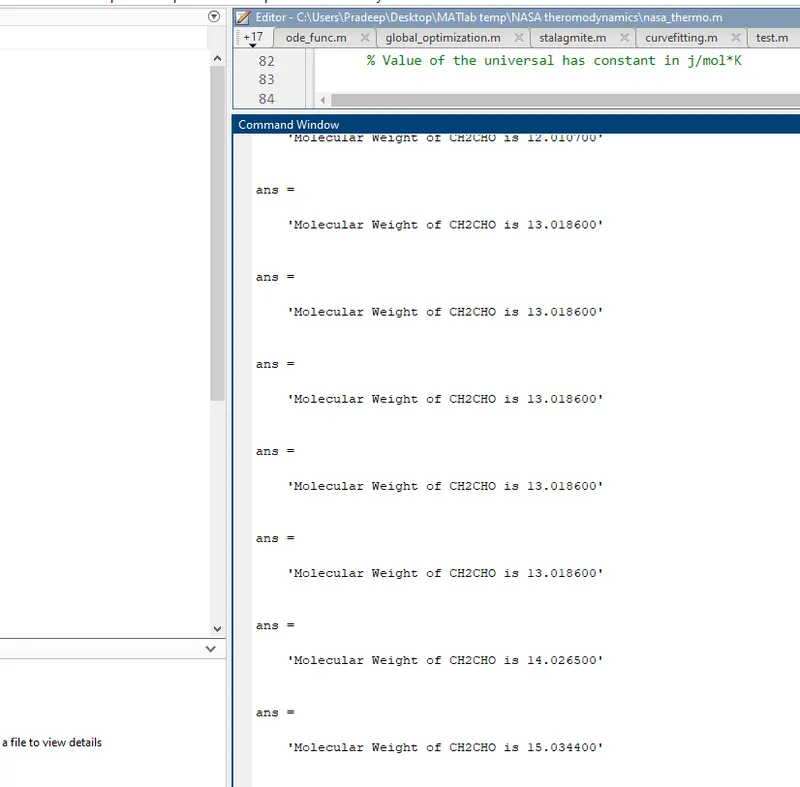
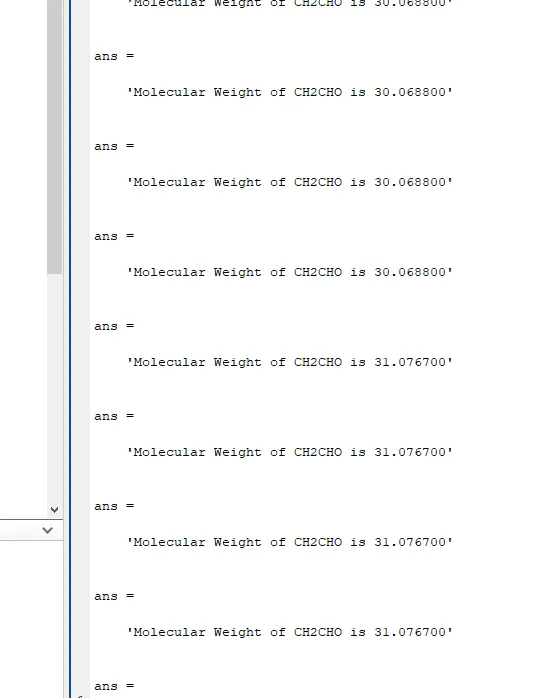
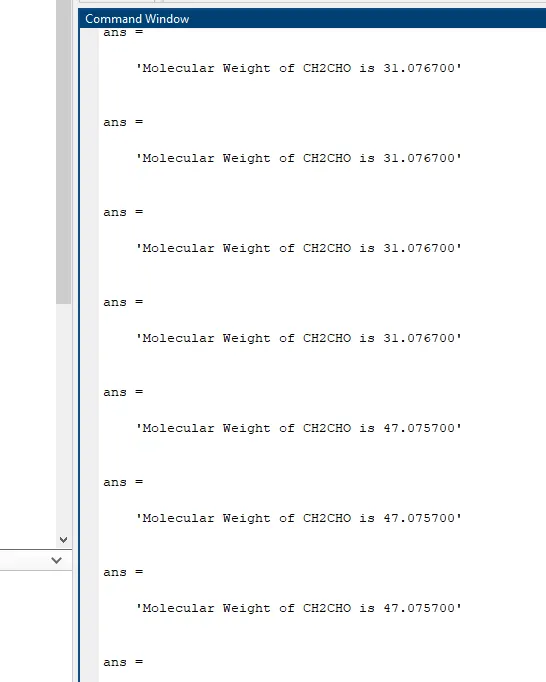
2. To calculate the molecular wt. of each species and display it in command window.
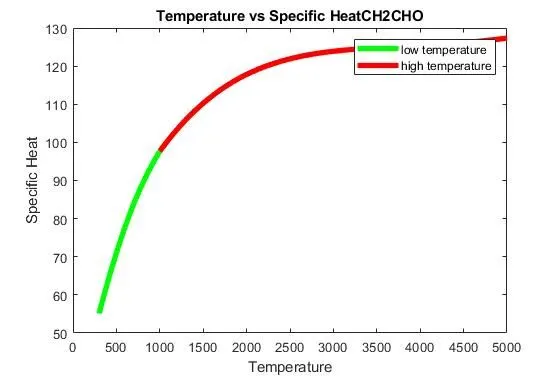
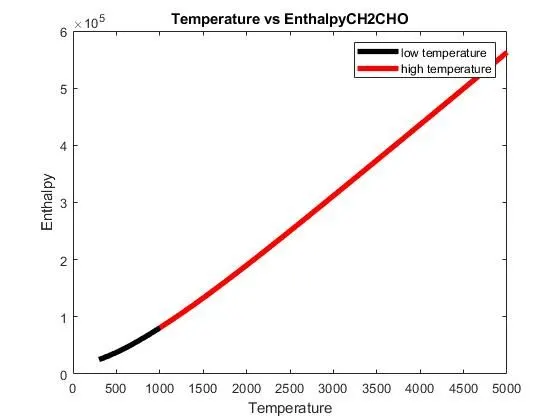
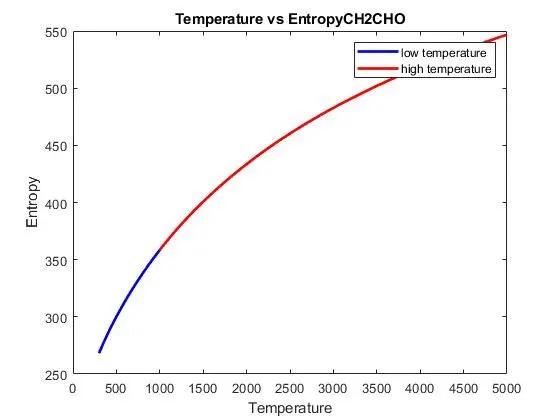
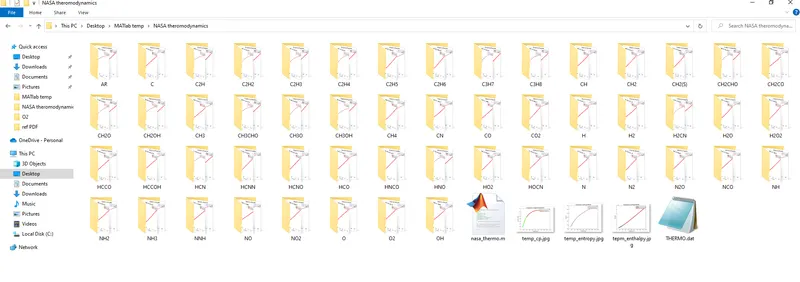
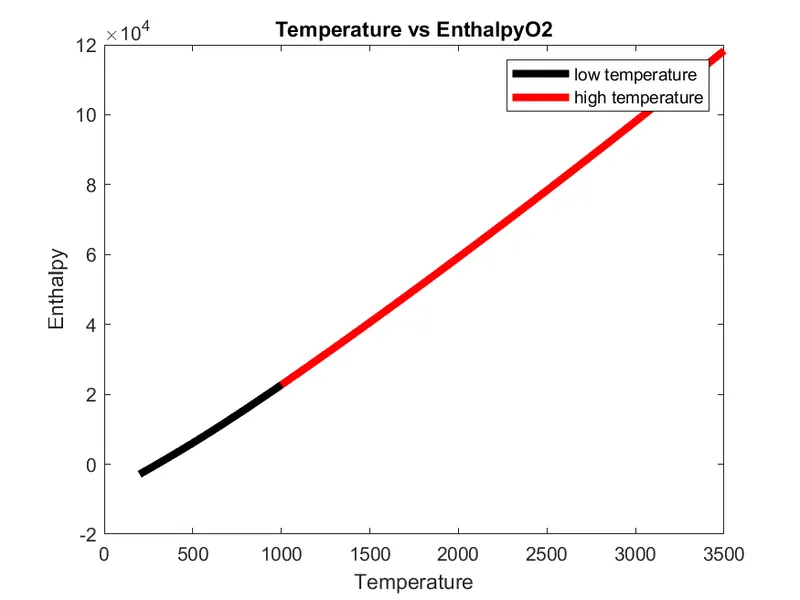
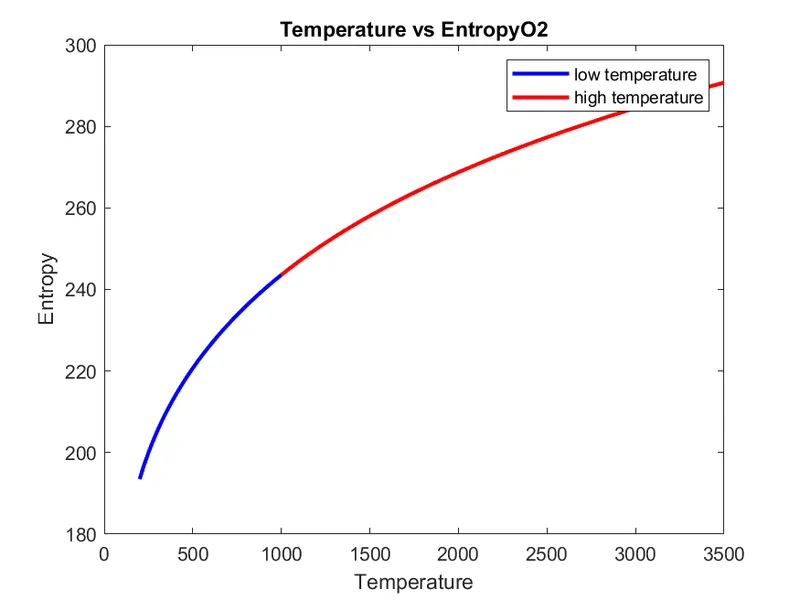
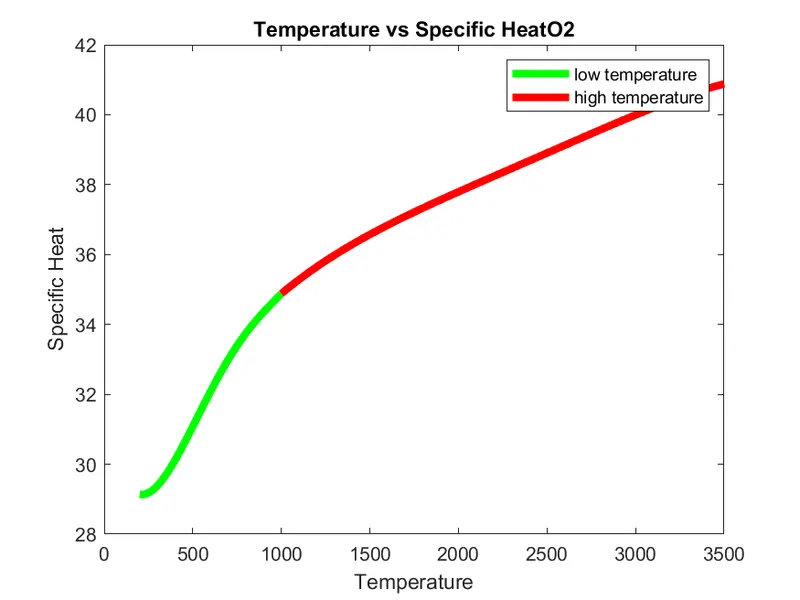
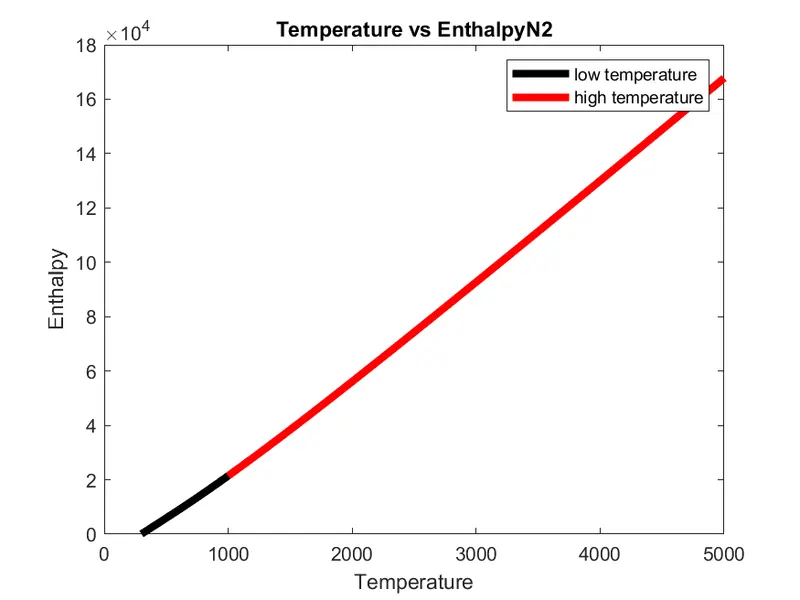
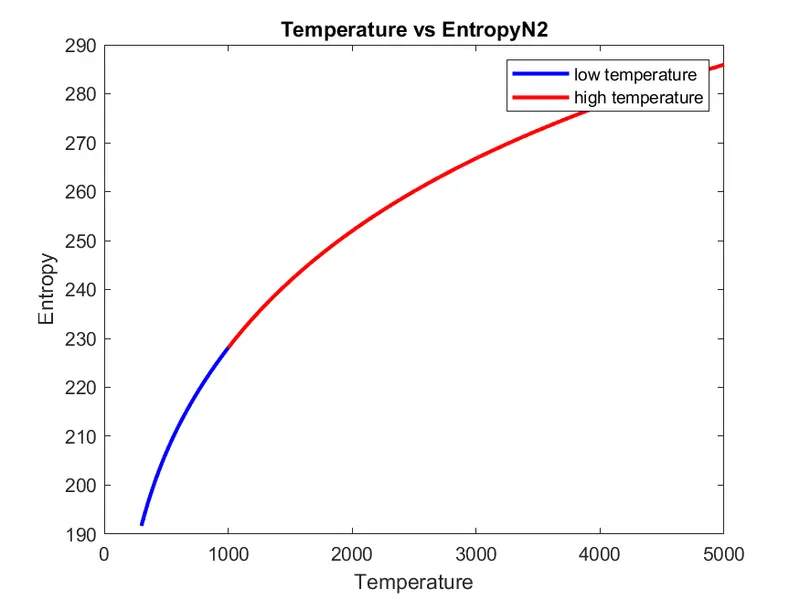
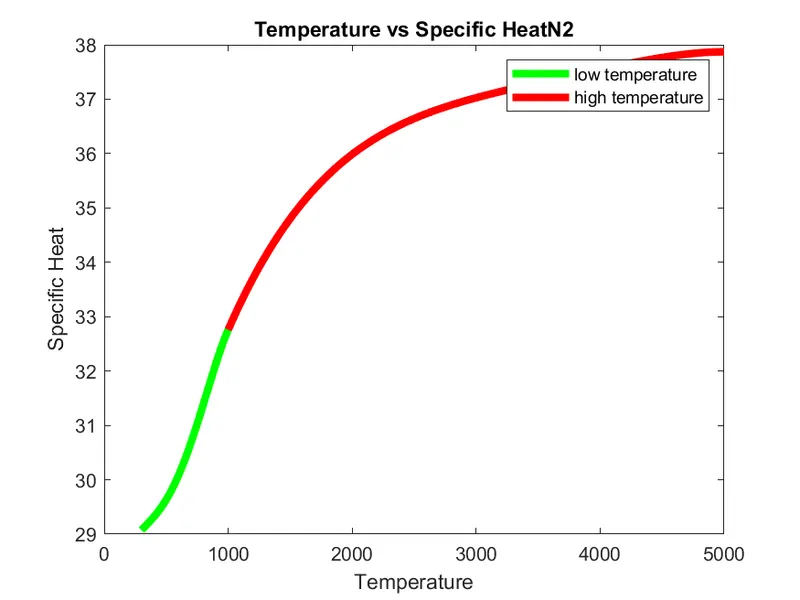
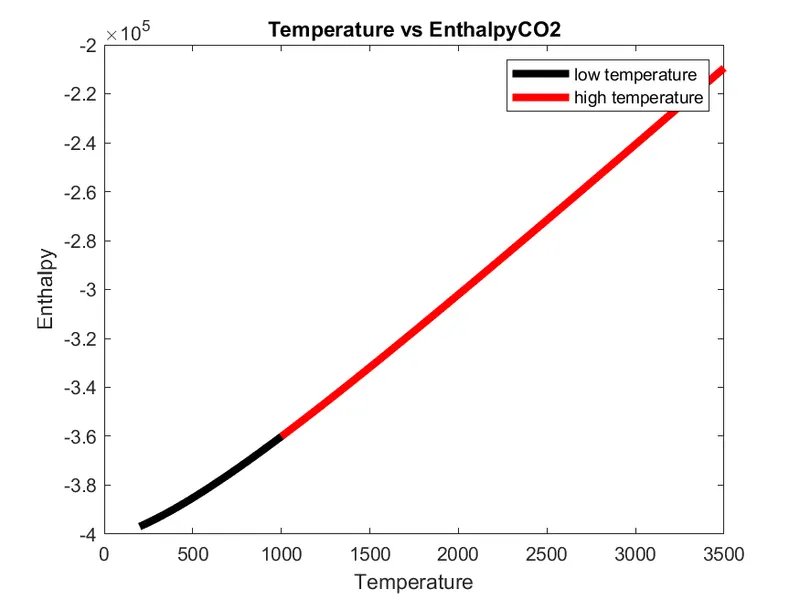
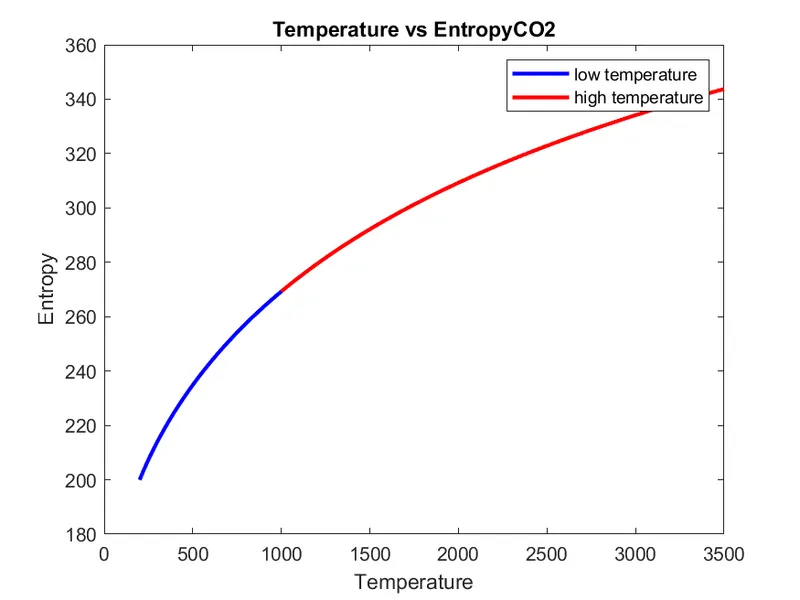
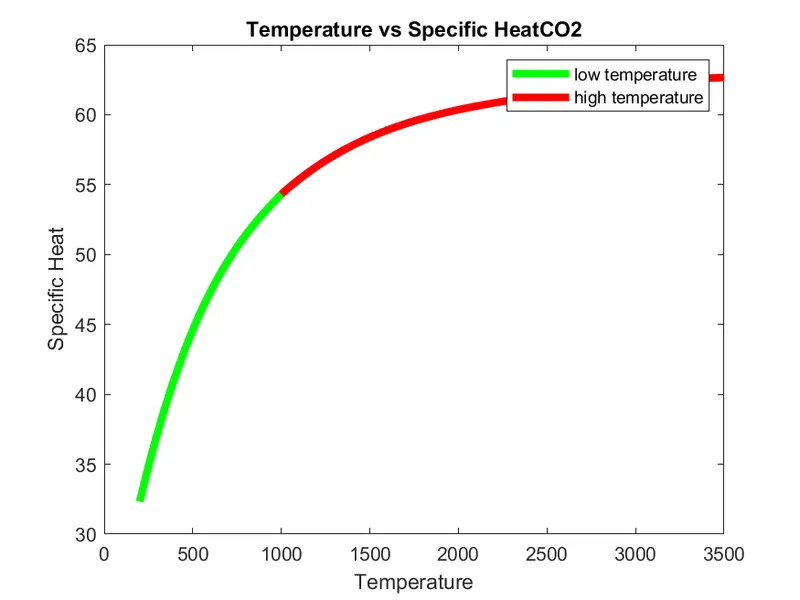
3. To plot Specific heat, enthaply and entropy for the local temp range (low to high temp) specific for each species. Save the plot as image with appropriate name and dump the in seperate folder for each species with suitable name. All these sholud be generated automatically.
CODE:
close all
clear all
clc


f1= fopen( 'NASA theromodynamics\THERMO.dat', 'r');
fgetl(f1);


%defining tempearture values
templ= str2num(fgetl(f1));
global_low_temp = templ(1);
global_mid_temp = templ(2);
global_high_temp = templ(3);


%for skipping unwanted lines

for i= 1:3
    fgetl(f1);
end


for i= 1:53
    line1=fgetl(f1);
    l= strsplit(line1, ' ');
    m= length(l);
    species = l{1};

    %storing the values of the local temp values
    low_temp= str2double(l(m-3));
    high_temp= str2double(l(m-2));
    mid_temp= str2double(l(m-1)); % check this later


    % storing the values of the second line of variable
    line2 = fgetl(f1);


    %finding the position of E
    a= strfind(line2, 'E');


    %reading all the other variables
    a1= str2double(line2(1:a(1)+3));
    a2= str2double(line2((a(1)+4):(a(2)+3)));
    a3= str2double(line2((a(2)+4):(a(3)+3)));
    a4= str2double(line2((a(3)+4):(a(4)+3)));
    a5= str2double(line2((a(4)+4):(a(5)+3)));


    % Stroing the value of the 3rd line
    line3= fgetl(f1);

    %finding the position of E
    b = strfind(line3,'E');

    % storing the values for the next set of variables
    a6 = str2double(line3(1:b(1)+3));
    a7 = str2double(line3((b(1)+4):(b(2)+3)));
    a8 = str2double(line3((b(2)+4):(b(3)+3)));
    a9 = str2double(line3((b(3)+4):(b(4)+3)));
    a10 = str2double(line3((b(4)+4):(b(5)+3)));

    %storing the values of the 4th line
    line4=fgetl(f1);

    %finding the position of E
    c = strfind(line4,'E');

    % Storing the values of variables in line 4
    a11 = str2double(line4(1:c(1)+3));
    a12 = str2double(line4((c(1)+4):(c(2)+3)));
    a13 = str2double(line4((c(2)+4):(c(3)+3)));
    a14 = str2double(line4((c(3)+4):(c(4)+3)));

    % Creating Temperature values for lower and higher temperature
    lower_temp = linspace(low_temp,mid_temp,100);
    higher_temp = linspace(mid_temp,high_temp,100);

    % Value of the universal has constant in j/mol*K

    % Universal Gas Constant
    R = 8.314;

    % Calculating the values for cp, H and S using the given formulas

for k=1:100


    % lower temperature values for cp,h,s calculations i.e low to middle temp values

    cp_low(k)=((a8+(a9*lower_temp(k)))+(a10*(lower_temp(k)^2))+(a11*(lower_temp(k))^3)+(a12*(lower_temp(k))^4))*R;

    h_low(k)=((a8)+(a9*lower_temp(k)/2)+((a10*lower_temp(k)^2)/3)+((a11*lower_temp(k)^3)/4)+((a12*lower_temp(k)^4)/5)+(a13/lower_temp(k)))*(R*lower_temp(k));

    s_low(k)=((a8*log(lower_temp(k))+(a9*lower_temp(k))+((a10*lower_temp(k)^2)/2)+((a11*lower_temp(k)^3)/3)+((a12*lower_temp(k)^4)/4)+a14)*R);


    % higher temperature values for cp,h,s calculations i.e mid to high temp values

    cp_high(k)=((a1+(a2*higher_temp(k)))+(a3*(higher_temp(k)^2))+(a4*(higher_temp(k))^3)+(a5*(higher_temp(k))^4))*R;

    h_high(k)=((a1)+(a2*higher_temp(k)/2)+((a3*higher_temp(k)^2)/3)+((a4*higher_temp(k)^3)/4)+((a5*higher_temp(k)^4)/5)+(a6/higher_temp(k)))*(R*higher_temp(k));

    s_high(k)=((a1*log(higher_temp(k))+(a2*higher_temp(k))+((a3*higher_temp(k)^2)/2)+((a4*higher_temp(k)^3)/3)+((a5*higher_temp(k)^4)/4)+a7)*R);

end


% Plotting Cp, H and S with Temperature

% Making Folders for saving the plots
mkdir(species);
current = pwd;
cd(species);


%Plotting the graphs

% For specific heat

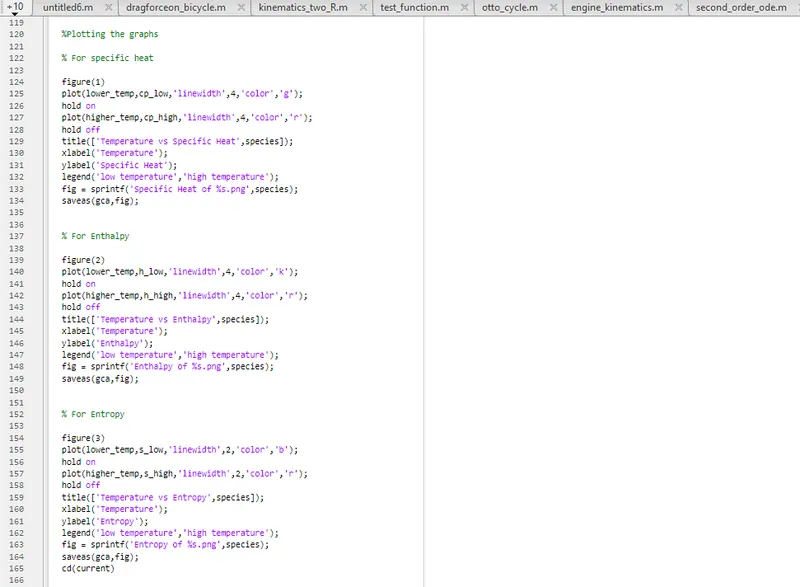
figure(1)
plot(lower_temp,cp_low,'linewidth',4,'color','g');
hold on
plot(higher_temp,cp_high,'linewidth',4,'color','r');
hold off
title(['Temperature vs Specific Heat',species]);
xlabel('Temperature');
ylabel('Specific Heat');
legend('low temperature','high temperature');
fig = sprintf('Specific Heat of %s.png',species);
saveas(gca,fig);


% For Enthalpy

figure(2)
plot(lower_temp,h_low,'linewidth',4,'color','k');
hold on
plot(higher_temp,h_high,'linewidth',4,'color','r');
hold off
title(['Temperature vs Enthalpy',species]);
xlabel('Temperature');
ylabel('Enthalpy');
legend('low temperature','high temperature');
fig = sprintf('Enthalpy of %s.png',species);
saveas(gca,fig);


% For Entropy

figure(3)
plot(lower_temp,s_low,'linewidth',2,'color','b');
hold on
plot(higher_temp,s_high,'linewidth',2,'color','r');
hold off
title(['Temperature vs Entropy',species]);
xlabel('Temperature');
ylabel('Entropy');
legend('low temperature','high temperature');
fig = sprintf('Entropy of %s.png',species);
saveas(gca,fig);
cd(current)

%Molecular weight calculation

% species elements vector
elements = ['H','C','O','N','A'];

% the atomic weight value of respective species
atomic_weight = [1.0079 12.0107 15.999 14.0067 39.948];

% Declaring molecular weight to be '0'
mol_wt = 0;

for l = 1:length(species)
for m = 1:length(atomic_weight)

if strcmp(species(l), elements(m))
   mol_wt = mol_wt + atomic_weight(m);
   position = m;
end

   n = str2double(species(l));

if n>1
   mol_wt = mol_wt + atomic_weight(position)*(n-1);
end

% Printing the molecular weight of the gas species in the command window
sprintf('Molecular Weight of %s is %f',species,mol_wt)

end

end

end

fclose(f1)
CODE EXPLANATION: (ref images for each are given below)
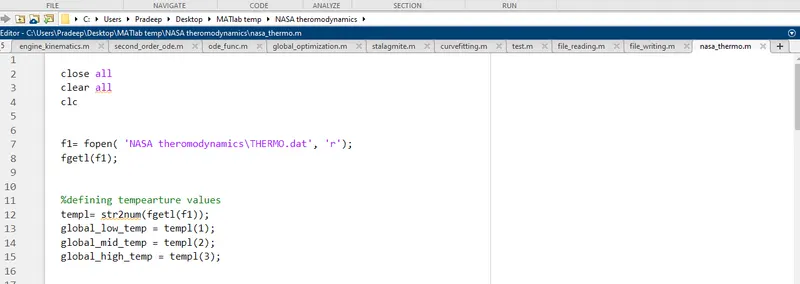
- Let us open the data file (fopen) command, and the lines were read and extracted using (fgetl) command
- The temperature (low, mid and high) were read and stored as (global_low_temp, global_mid_temp & global_high_temp).
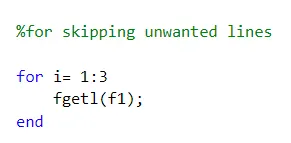
- Then the next three lines in the file are skipped (because it does not contain any values)
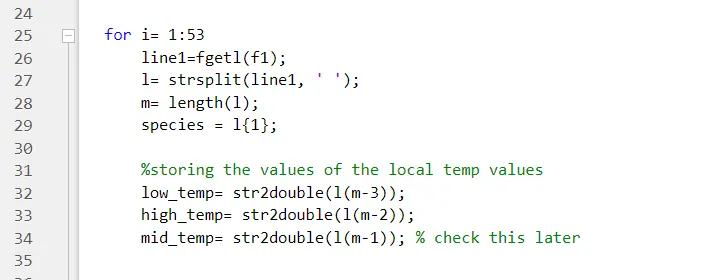
- In this step, let us consider there are 53 species, so to run all we are creating for loop for it. in that the vaules are like string so we are converting it to numbers and considering it as low, medium and high temperature.
- And then the coefficient like a1, a2, a3, a4, a5 were extracted using (strdouble) command.
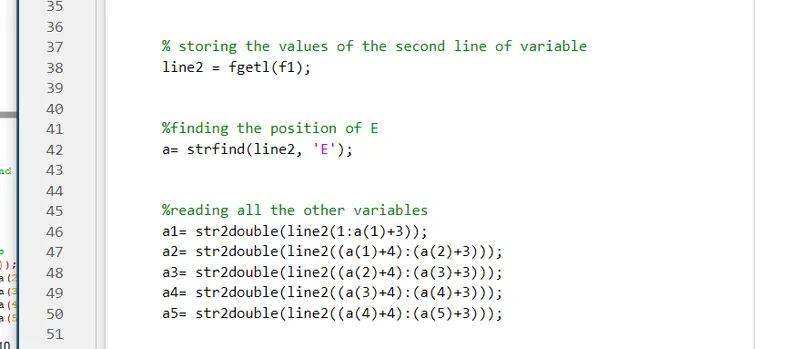
- And again, here the coefficient like a6, a7, a8 ...to a15 were extracting using (strdouble) command.
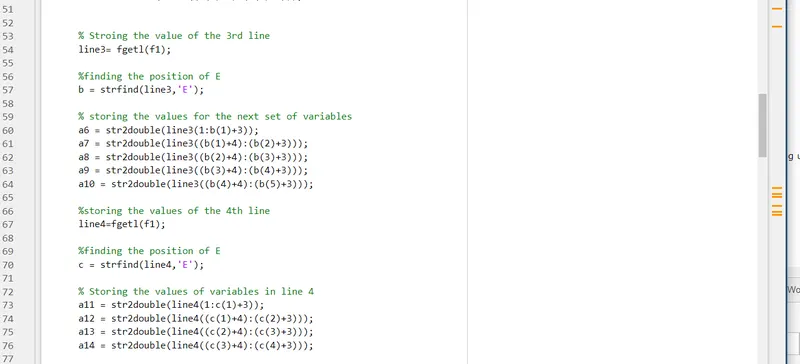
- Then the two temperature array (linspace command is used) were define in the local low to mid to high temperature range and the values are stored as Lower_temp and higher_temp. Also the universal gas constant is mentioned
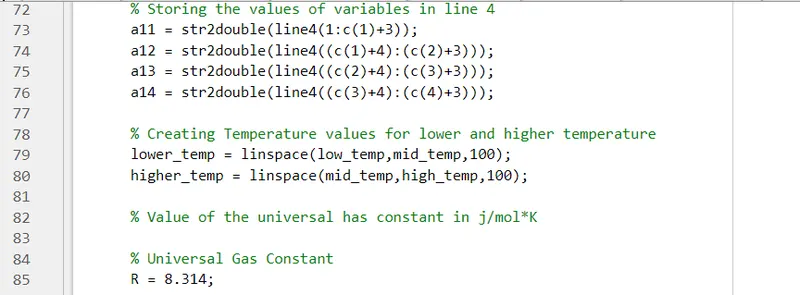
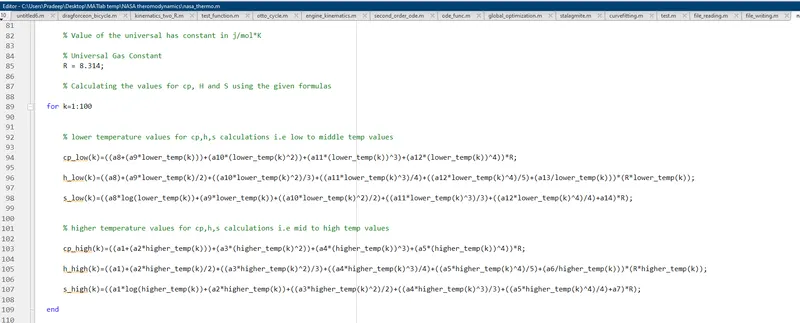
- Then the for lopp is run for 100 times (lower and higher temperature).
- Hence for calculating the low and high (enthalpy, entropy and specific heat) the formulas are used
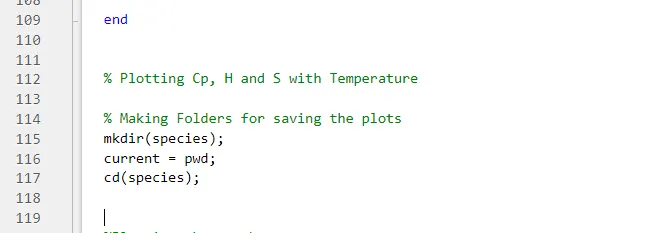
- And finally it saved in different folder for each species
- Them finally the graph are being plotted between (low and high temperture) for entropy, enthalpy and specific heat.
Resultant Graphs are,
Molecular Weight calculation:
- generally the molecular weight are calculated using atomic weigth.
- then the for loop is used to detect if there are more one species in the variable species, (strcmp) command is used to ccompare and match the elemets and species for furture process.
- here str2double command is convert the species to number.
- if loop (n>1) is used to multiply the (n-1) to previous position value.
- the end we use sprintf to print the name and its weigth and all the loop is closed and followed by fclose to close the files.
Folders:
Plot of O2:
PLOT of N2:
PLOT of CO2:
Errors faced:
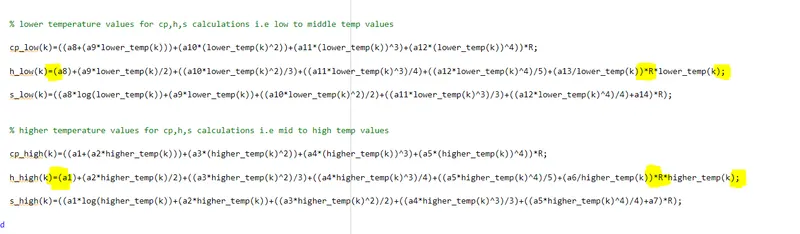
I have faced lot of errors, i will show the main error that take more time to solve
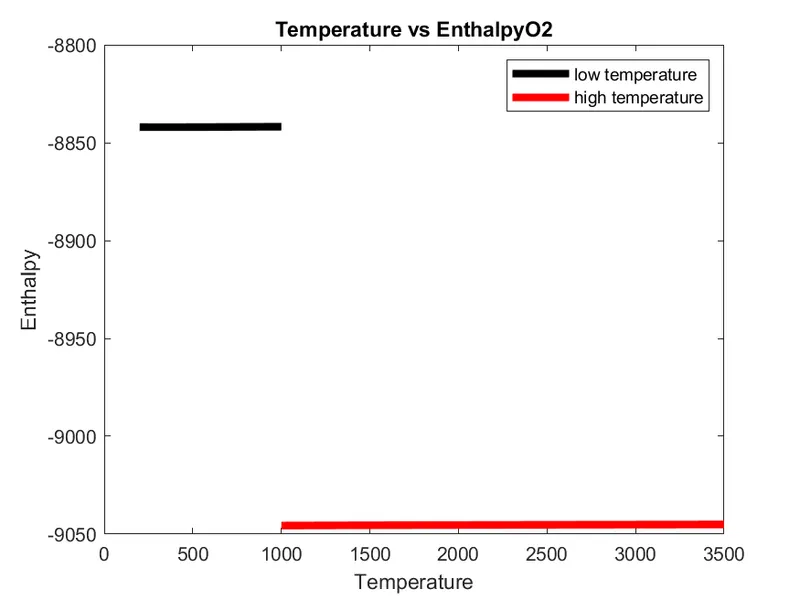
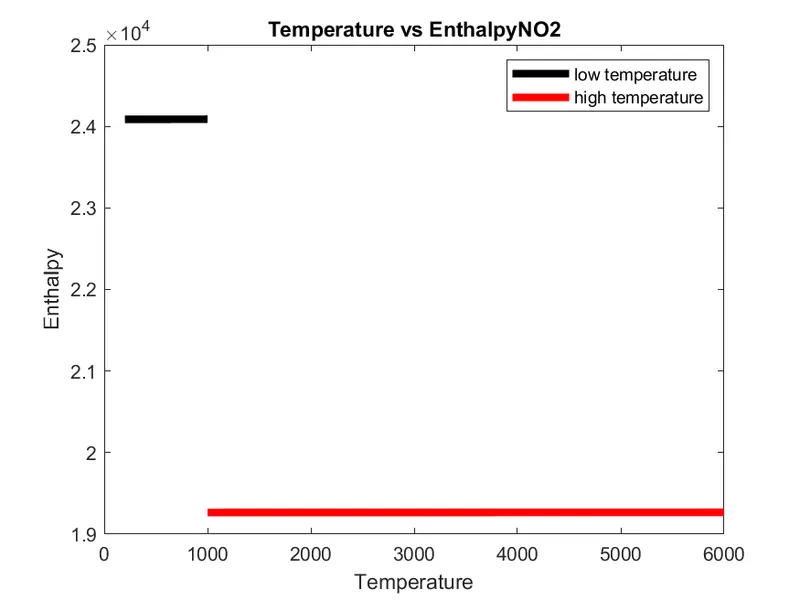
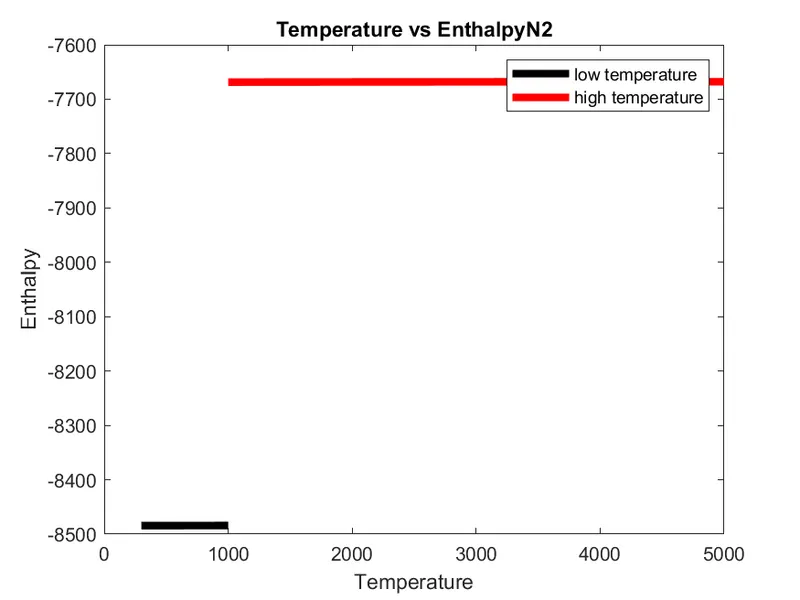
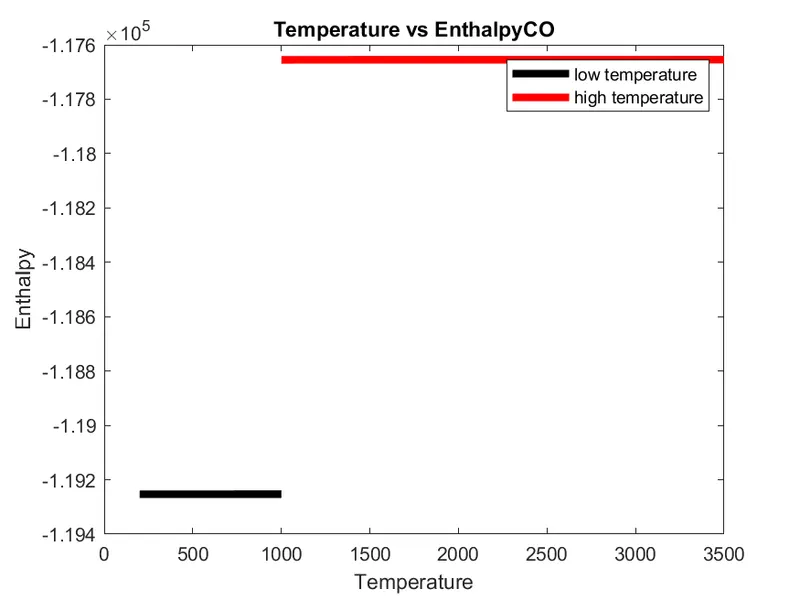
Missed bracket in the formuls, so the graph are breaking.
Breaking graphs:
Steps to overcome:
I have again and again checked the values and understand the usage of each codes in this program.
Referances:
https://in.mathworks.com/help/instrument/scanstr.html
https://in.mathworks.com/matlabcentral/answers/472084-how-to-parse-text-data
https://in.mathworks.com/videos/parsing-code-for-better-understanding-97430.html