Project
AIM:
To study and analysis the baja all terrain vehicle(ATV) model using simulink and compare between different models.
OBJECTICES:
*To prepare a technical report explaining the function of the subsystems & blocks used for preparing the model
*To explain in detail all the differences between all the five models provided
*To understand and comment on the results
TYPES OF MODEL studied:-
*BAJA ATV model without dashboard
*BAJA ATV model - data extraction
*BAJA ATV model with dashboard
*BAJA ATV model-mapped lookup table without dashboard
* BAJA ATV model -mapped lookup table with dashboard
INTRODUCTION:-
An ATV is define as a monitorized off highway vehicle designed to travel on four low pressure or non pneumatic tires having seat desinged to be straddled by the operator and handlebars for steering control.ATVs are subdivided into types as desingated seating position behind the operator.
BAJA SAE:
Baja sae is an collegate desingn series competition run by the society of automotive engineers teams of students from universities all over the world design and build small off road cars .the cars all have engines of the same specifications.as of 2018 the engine has been an unmodified briggs and stratton model19 vangures engine single cylinder with a displacement of 305cc and power output of approximate 10bhp.
Continuousely variable transmission(cvt):-
A continuously variable transmission that can change seamlessly through a continous range of gear ratios .this contrasts with other transmissions that provide a limited number of gear rations in fixed steps.The flexibility of a CVT with suitable control may allow the engine to operate at a constant RPM while the vehicle moves at varying speeds.
Main and critical blocks used:-
Generic Engine block:-
The generic engine block represents a general internal combustion engine .engine types include spark-ignition and diesel .speed-power and speed-torque parameterizations are provided.a throttle physcical signal input specifies the normalized engine torque optional dynamic parameters inlcude cranckshaft inertia and response time lag .a physical signal port outputs engine fuel consumption rate based on choice of fuel consuption model .optional speed and redline controllers prevent engine stall and enable cruise control.
Simple gear:-
The simple gear block represents a gearbox that constrains the connected driveline axes of the base gear, B,and the follower gear ,f,to corotate with a fixed ratio that is specified
Variable ratio transmission block:-
The variable ratio transmission block represents a gearbox that dynamically transfers motion and troque between the two connected driveshaft axes base and follower ignoring the dynamics of transmission compliance to corotate with a variable gear ratio control that you control.you can choose whether the follower axis rotates in the same or opposite direction as the base axis .if they rotate in the same or opposite direction as the base axis .if they rotate in the same direction wf and wb have the same sign.if they rotate in opposite direction wf and wb have opposite signs
Limitations:-
The vehicle body block lets you model only longitudinal dynamics parallel to the ground and oriented along the direction of motion .The vehicle is assumed to be in pitch and normal equilibrium.The block does not model pitch or vertical movement .As such the equations assume that the wheels never lose contact .This constraint can result in negative normal forces.
Input ports:-
1.Beta-road incline angle physical signal input port fot road incline angle
2.W-head wind speed physcical signal input port for road inline angle
3.CG-center of gravity :physical signal input port of externally defined mass relative to the cg of vehicle
4.M-mass :physical signal input port for mass of the externally defined mass
5.J-externally defined moment of inertia :physical signal input port of externally defined mass
Output ports:
*NR-Rear axle normal force physical signal output port of thr rear axle which is considered positive acting downward
*NF- front axle normal force: physical signal output port for thr front axle which is considered positive acting downward
*V-longitudinal velocity:physical output signal of vehicle velocity
Consrving ports:-
H-horizontal motion:conserving port related to the horizontal motion of vehicle body
Double shoe brake block:-
The double-shoe brake block represents a frictional brake with two pivoted rigid shoes that press against a rotating drum to produce a brake action .
Tire(magic formula)block:-
The tire block models a tire with logitudinal behavior given by magic formula an emprical equation based on four fitting coefficients.the block can model tire dynamics under constant or variable pavement conditions
Other blocks used:-
1.Solver configuration - To specify the solver parameters before starting the simulation
2.Signal Builder -To input the brake,throttle and CVT ratio
3.Simulink to ps converter-To convert the simulink signal to simscape environment
4.ps to simulink converter-To convert simscape signal to simulink environment
5.Mechanical Reference - To make sure all the components are clamped to the ground
6.Rotational free end - The rotational free end block represents a mechanical rotatinal port that rotates freely without torque
7.scope-To display different graphs
8.Display-To view the calculated engine power
9.Inertia-To represent the solid inertia
10.Rotational motion sensor -To sense the rotational motion from the engine and give output as rpm
11.PS Terminator-Terminator for unconnected physical signal outputs
12.PS constant - Generate constant physical signal
13.Rotational free end-For mechanical component
14.custom measure gauge -To measure the brake and throttle input
15.Knob - To increase ,decrease and vice-versa of throttle and brake inputs
16.Lookup table- to insert the CVT values from the workspace
17.Step-To increase or decrease an input value for a defined time interval
BAJA ATV MODEL WITHOUT DASHBOARD:-
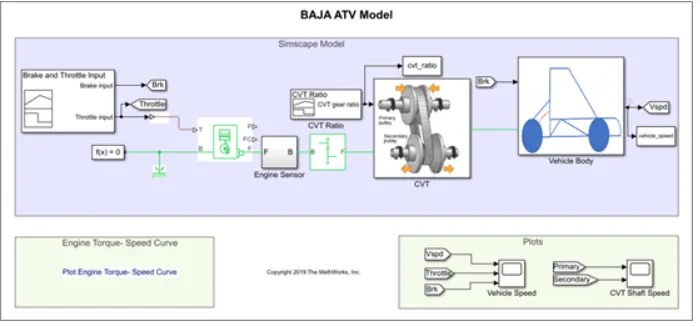
Steps:
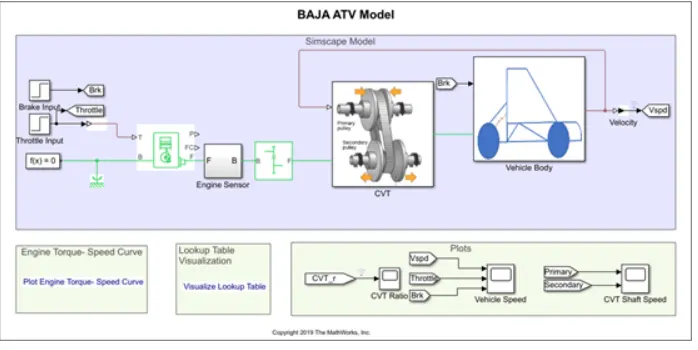
*The throttle signal is generated by signal builder block and inputted to generic engine
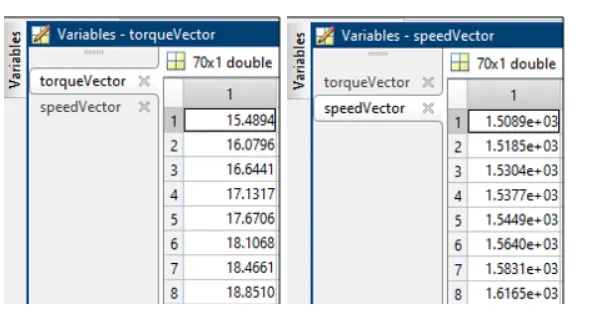
*The torque and speed vector are inputted feom the matlab workspace
*The engine will generate the output rpm which can be taken from the crankshaft output.this speed will be given to the ideal rotational motion sensor to sense the output rpm
*The same output speed will be given to a simple gear mechanism to reduce the speed where the gear ratio is 4
*Then the output speed from the gear reducer will be given to the variable ratio transmission block
*The CVT ratio is provided to the variable ratio transmission block through signal builder
*The speed is controlled by the variable CVT ratio and the controlled output speed is inputted to the vehicle axle
*The brake signal is generated by the signal builder and inputted to the vehicle body for applying the brake to axle
*The power from the CVT is inputted to the axle and the vehicle accelarates according to the speed
*Then the velocity is taken as output from the vehicle body for further analysis
Torque and speed :
CVT ratio input:
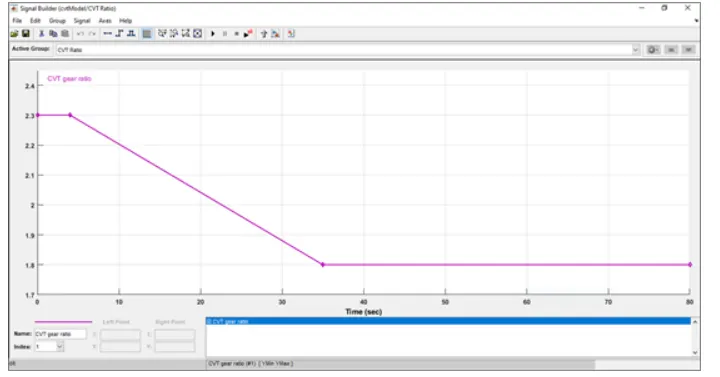
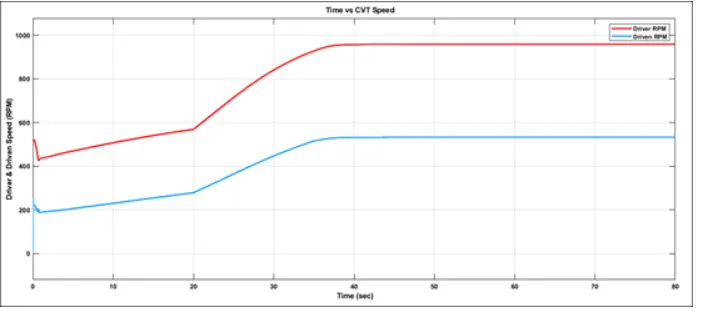
Cvt ratio starts at 2.3, then 5sec it gradually reduces until it reaches 1.8 at 35th second and it remains so till the end of the simulation
ENGINE SENSOR SUB-BLOCK:
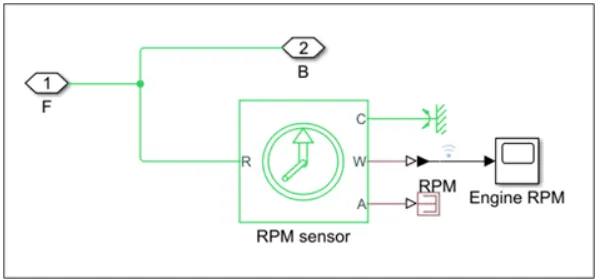
This subblock measure engine rotational speed as it takes the output of the engine as its inputs and outputs engine RPM
CVT SUBBLOCK:
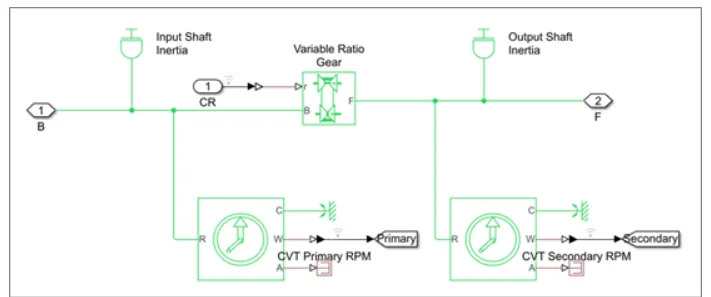
The cvt subblock provides the input and the output shaft of the cvt with inertia and measures the input shaft rpm and the output shaft rpm
Vehicle body subblock:
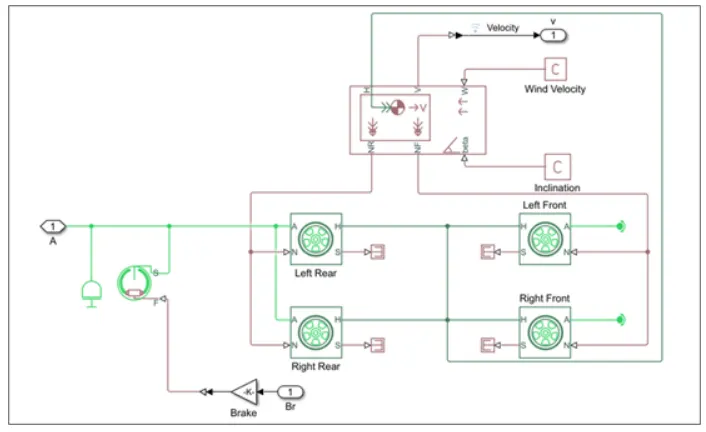
The model shows that the vehicle is rear wheel drive as the output from the gearbox is putted to the rear axle then an inertia is added to simulate axle inertia then the shoe brake is conserving port is connected to the axle and then the same axle connects the two rear tyres while the front tyres is free to rotate on a rotational free end .all the tyres H hub port is connectd together and then connected to the vehicle H port also the rear tyres N port is connected together and then connectedto the vehicle body Nr output ports while the front are connected to the Nf vehicle body output ports the vehicle body takes the road inclination and wind velocity from physical constants
Results:
Torque speed plot:
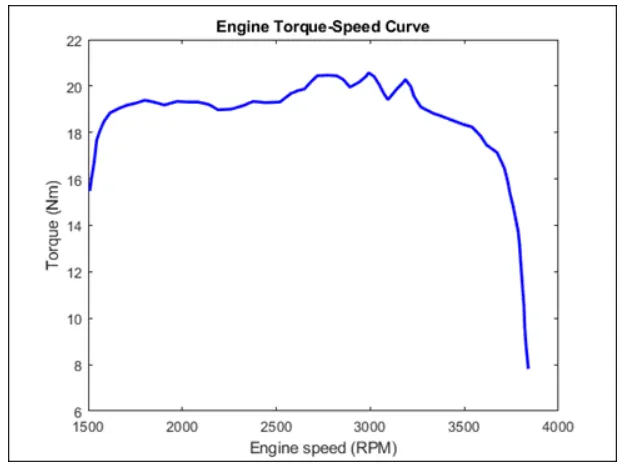
The torque and speed are inputted from the matlab workspace window to the generic engine block to generate the output RPM accordingily .this plot behavior is generic to all ICE
Engine speed plot:
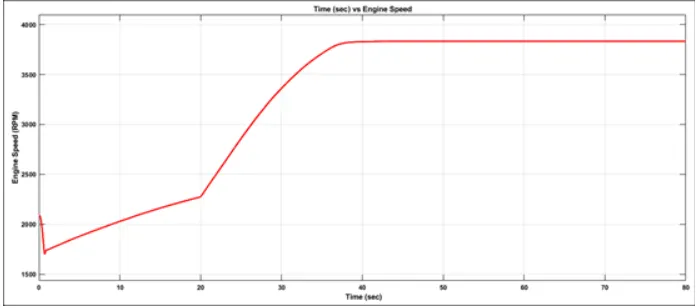
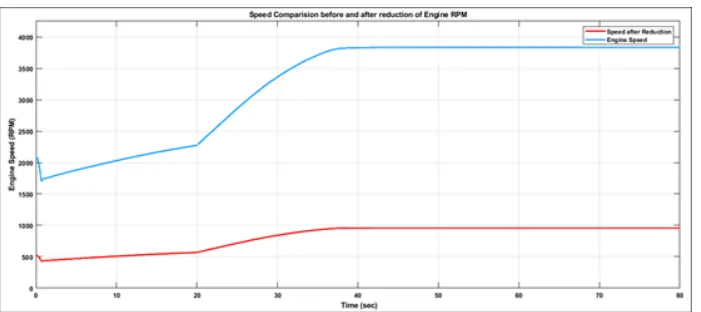
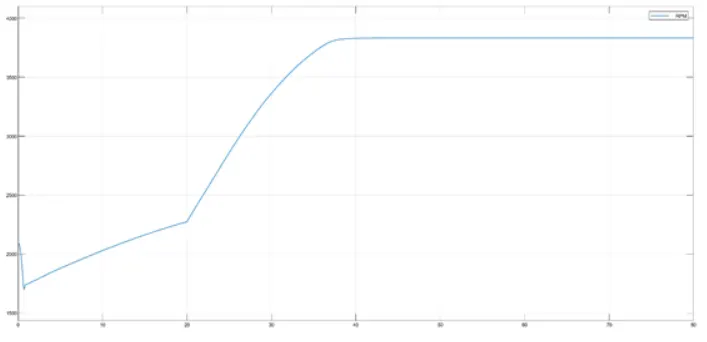
The engine rpm generated according to the throttle speed and torque inputs.it is clearly evident how the step increase in throttle at 20th second resulted in an increase in the engine revolutions from 2,250 to 3,800RPM
Engine speed vs gear reduction speed plot:
CVt speed reduction plot:
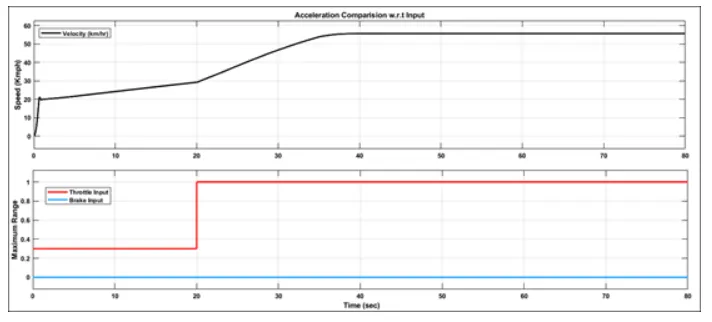
Speed vs throttle plot:
BAJA ATV model -data Extraction(cvtmodel_data)
Main model
Steps:
The model workflow process is same as the process of baja atv model without dashboard .the small addition is here the cvt ratio and vehicle speed data are extracted using To workspace block
Result:
The result are same as BAJA ATV model without dashboard but an additional output is the CVT Ratio and vehicle velocity to the workspace
BAJA ATV MODEL WITH DASHBOARD(cvtmodel_dashboard):
Main model:
steps:
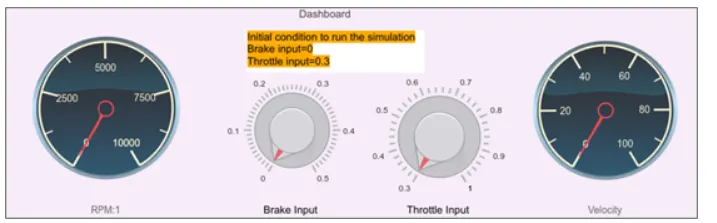
The model workflow process is same as the process of BAJA ATV model without dashboard but the throttle and brake inputs are controlled by the user with knobs
Results:
Engine speed plot:
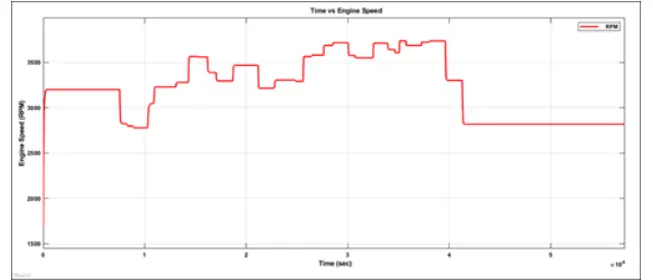
Here the engine speed is generated according to the inputs like throttle break torque and speed vectors. the runtime is not defined so that the throttle and break are controlled by the user . The step up is throttle and step down is brake input
Engine speed vs gear reduction speed plot:
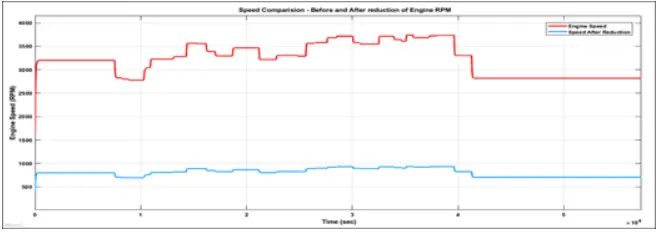
The engine speed is reduced by a factor of 4 at any moment in the drive cycle as it is evident by the curve
CVT Speed reduction plot:
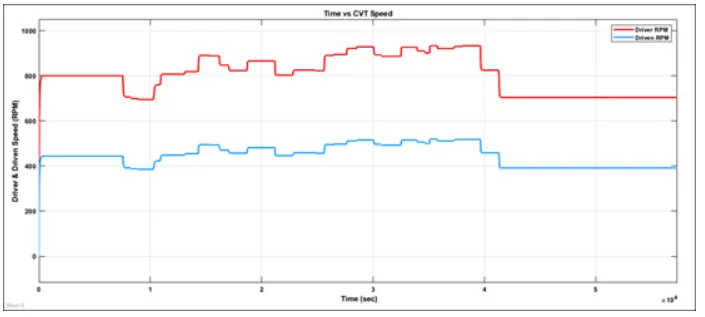
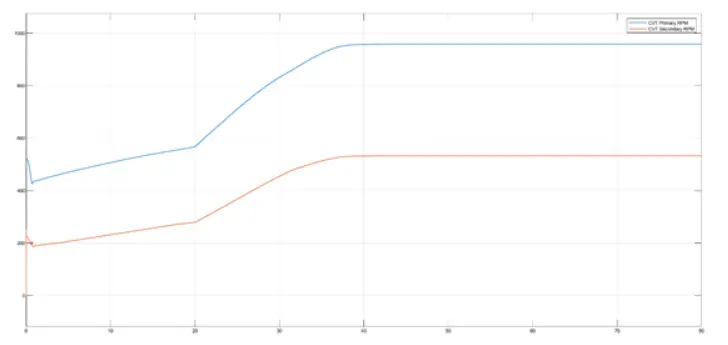
The cvt gear reduction plot shows that at constant the reduction ratio of 1.8 is applicable at these large time frame and it can be verified by taking 689 constant RPM and dividing it by 1.8=383RPM which verifies the plot
Speed vs throttle input:
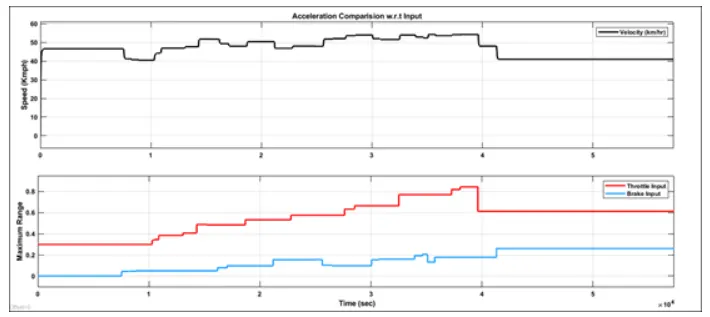
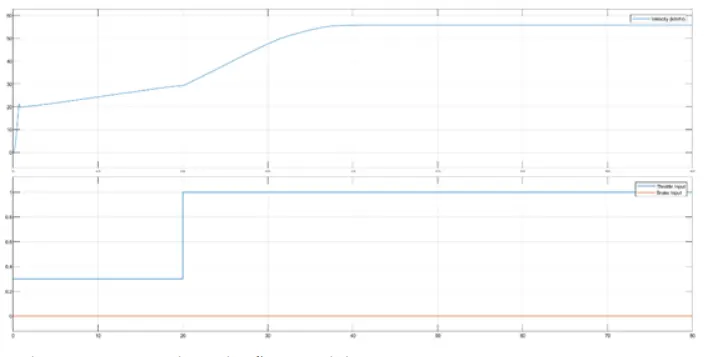
From the graph we can refer that the vehicle is accelarated while throttle is applied and decelerated while break is applied . the constant speed areas represent no changes in throttle or braking
BAJA ATV model-mapped lookup table without dashboard:
Main model:
Steps:
The model workflow process is same as the process of BAJA ATV model without dashboard except that it used instant of signal builder blocks for break anf throttle input step input blocks are used. At 35 sec the brake input will take a step of value 0 and at 20 sec throttle input will increase from 0.3-1 then remains constant throughout
CVT SUBBLOCK
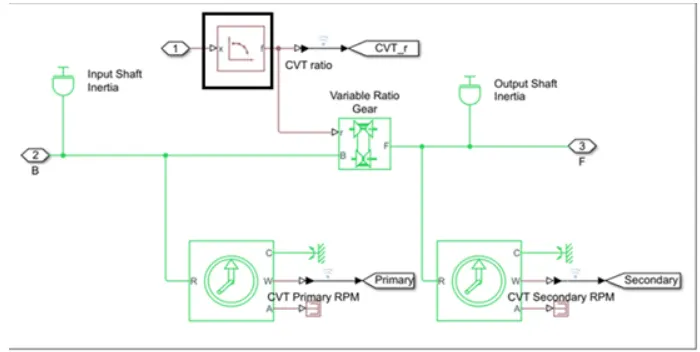
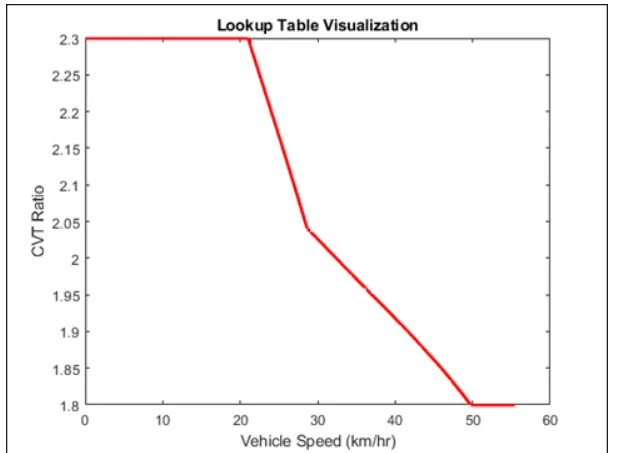
The cvt subblock is the same as the previous model BAJA ATV model without dashboard but instead of signal builder block for cvt ratio the 2-D lookup table is used. The interplotations and extrapolation method are set to linear .it needs to be loaded in the workspace having the file name as lookuptable_data.mat
Results:
Cvt ratio plot:
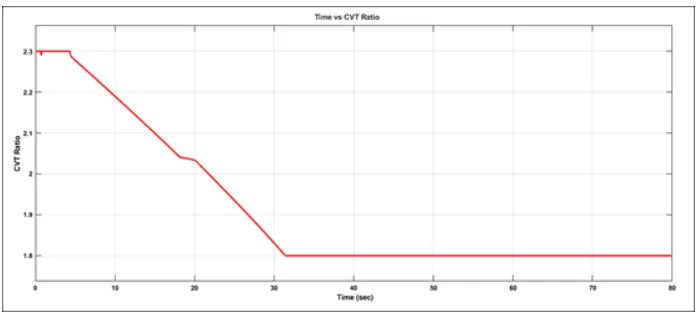
When we compare the above plot the ratio varies from 2.3-1.8 within timespan of 80sec which is same as the previous BAJA ATV Models and from 32sec its constant ratio of 1.8 compared to 35 sec in the first model. also the reduction from 2.3 ratio tp 1.8 is not perfectly linear as in the first model
CVT ratio vs vehicle velocity:
Engine speed:
CVT SHAFT SPEED:
Speed vs throttle plot:
BAJA ATV model-Mapped lookup table with dashboard :
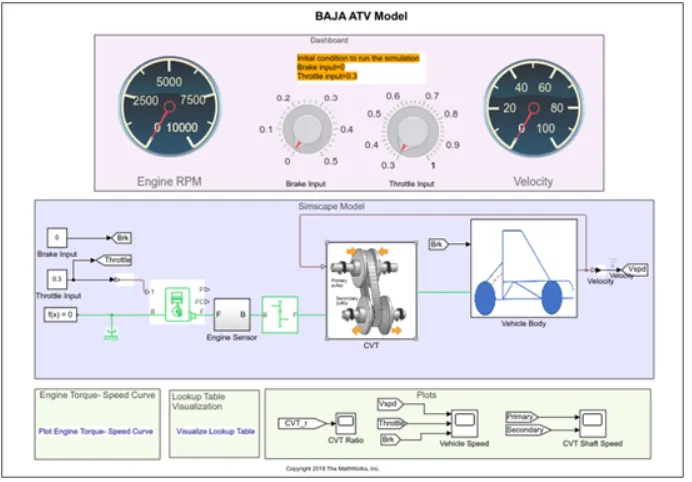
Dashboard(simulation off):
Dashboard(simulation on):
Steps:
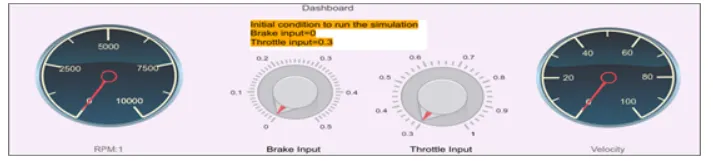
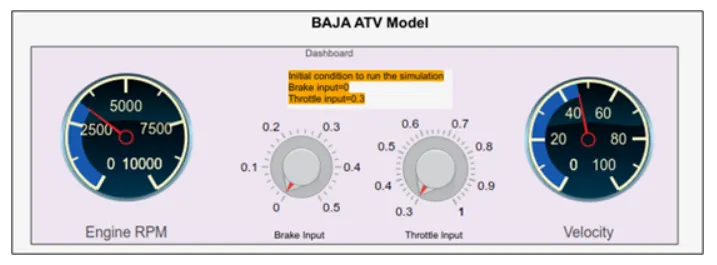
The model workflow process is same as the process of BAJA ATV model mapped lookup table wothout dashboard but the throttle and brake input are controlled by the user with the knob followed by the vehicle speed is given as feedback to the CVT Ratio lookup table
Results:
CVT ratio plot:
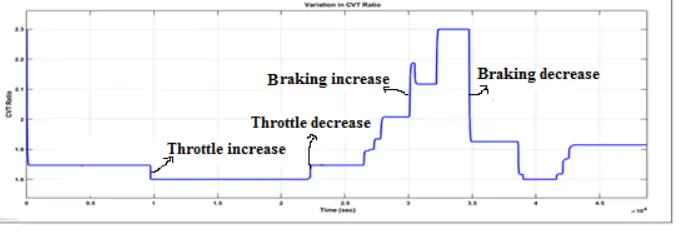
In this BAJA ATV Model the engine is preset to run at 3300 rpm with the throttle value of 0.3 and the velocity at 45 kmph. The CVT ratio for mimimum and maximum speed of the engine was predefined as 2.3 and 1.8 respectively. when the simulation is started the initial throttle value 0.3 is achieved so that the CVT ratio is nearby to 1.85.when the throttle is being increased the CVT ratio move towards 1.8 where the state is maximum engine speed.simulataneously when the throttle is being decreased the CVT ratio will move towards 1.85.while the braking is applied the CVT ratio increases so that it can achive the nearest state of 2.3 .
Engine speed plot:
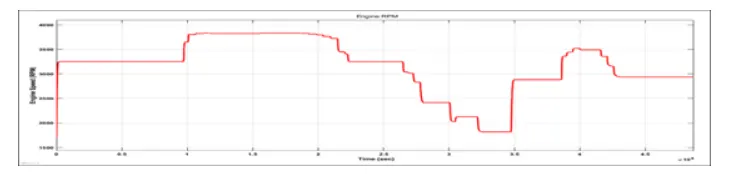
From the graph we can infer that the vehicle was first running at minimum rpm of 3300rpm and then throttle is applied then braking then brake is released so that engine rpm is increased then braking is applied
Cvt speed reduction plot:
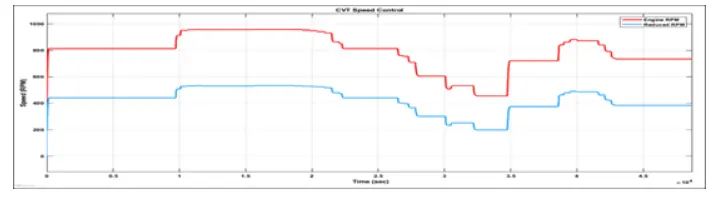
From the above graph we can understand that the throttle is applied and then kept constant then brake is released so that the engine speed is increased with increased with increase in throttle input.
Speed vs throttle plot:
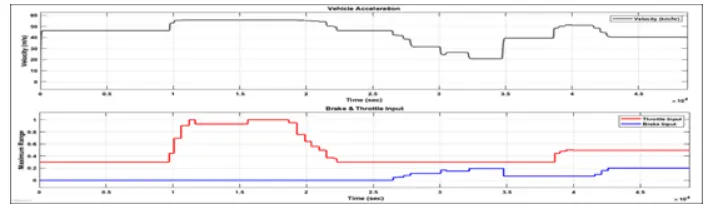
From the plot we can infer that when throttle is applied the vehicle speed increases and decreases simultaneously
REFERENCE:
Matlab help