Project 1 - Parsing NASA thermodynamic data
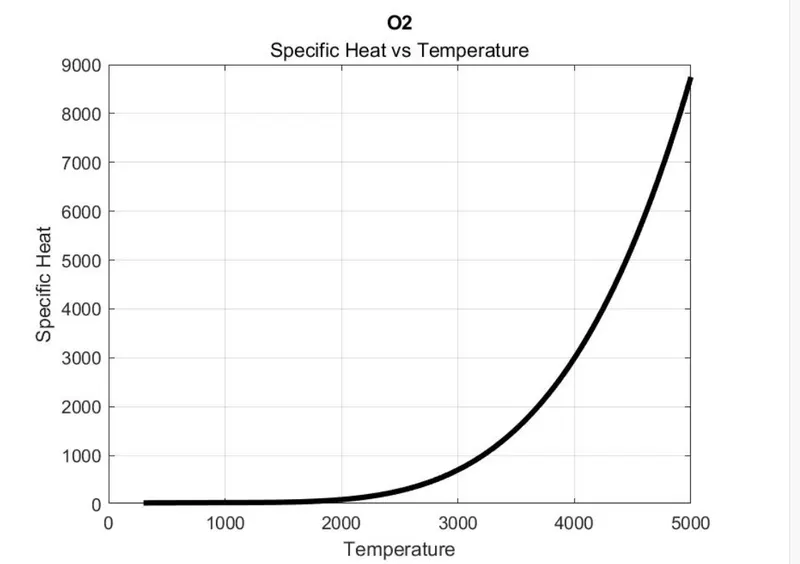
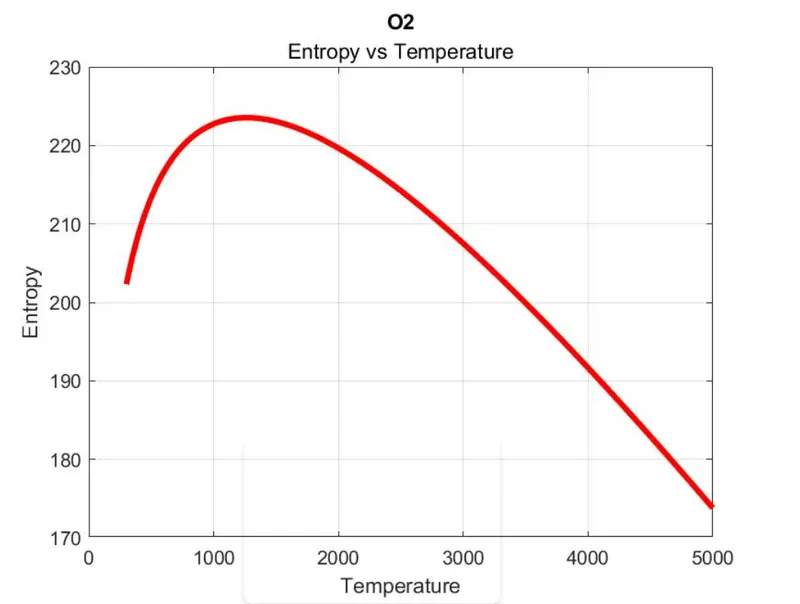
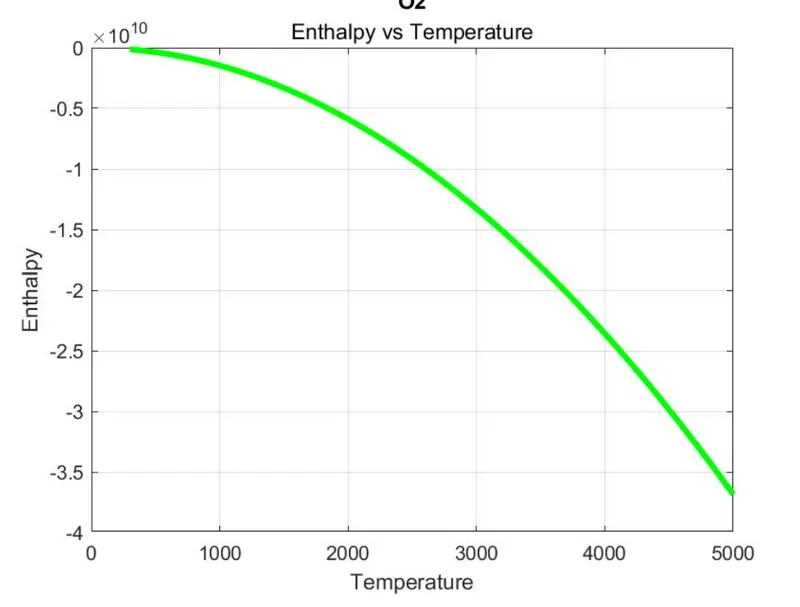
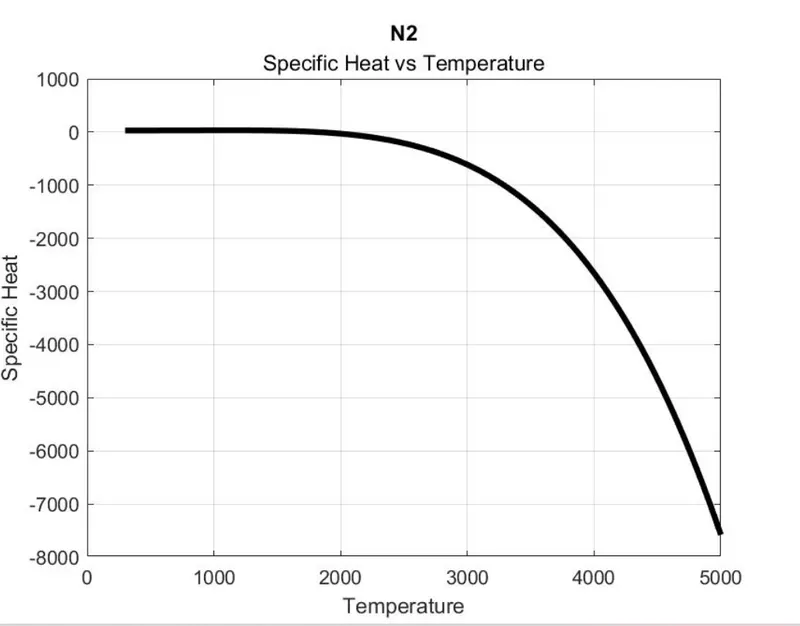
AIM:To write a function that extracts the 14 coefficient and to calculate the enthalphy,entropy and specific heats for all the species in the given NASA data file.and to calculate the molecular weight of each species and display it in the command window.and to plot the cp,enthalphy and entropy for the local temperature range specific for each species given in the data file.
FUNCTION PROGRAM FOR CALCULATING SPECIFIC HEAT;
%function program for specific heat
function[cp] = specific_heat(a1,a2,a3,a4,a5,a8,a9,a10,a11,a12,R,temp,global_mid_temp)
if temp >= global_mid_temp
    cp = R*(a1+(a2*temp)+(a3*(temp).^2)+(a4*(temp).^3)+(a5*(temp).^4));
else
    cp = R*(a8+(a9*temp)+(a10*(temp).^2)+(a11*(temp).^3)+(a12*(temp).^4));
end
end
PROGRAM FOR CALCULATING ENTHALPHY
%function program for enthalpy

function[h] = enthalphy(a1,a2,a3,a4,a5,a6,a8,a9,a10,a11,a12,a13,R,temp,global_mid_temp)
%function name and input values
if temp >= global_mid_temp
    h = R.*temp.*(a1+(a2.*(temp./2))+(a3.*(temp./3))+(a4.*(temp./4))+(a5.*(temp./5))+(a6.*(temp./6)));
else
    h = R.*temp.*(a8+(a9.*(temp./2))+(a10.*(temp./3))+(a11.*(temp./4))+(a12.*(temp./5))+(a13.*(temp./6)));
end
end
FUNCTION FOR CALCULATING ENTROPY
%function program for entropy
function [s] = entrophy(a1,a2,a3,a4,a5,a7,a8,a9,a10,a11,a12,a14,R,temp,global_mid_temp)
if temp >= global_mid_temp
    s = R.*(a1.*log(temp)+(a2.*temp)+(a3.*(((temp)./2)./2))+(a4.*(((temp./3)./3))+(a5.*(((temp)./4)./4))+a7);
else
    s = R.*(a8.*log(temp)+(a9.*temp)+(a10.*(((temp)./2)./2))+(a11.*(((temp)./3)./3))+(a12.*(((temp)./4)./4))+a14);
FUNCTION PROGRAM FOR CALCULATING MOLECULAR WEIGHT
%function program for claculating molecular weight
function[Mw] = molecular_weight(species_name)
element = {'H' 'C' 'N' 'O' 'Ar'}; %elements
atomic_weight = [1.00784 12.0107 14.0067 15.999 39.948];  %atomic weights
Mw=0;
for i = 1:length(species_name) %to calculate molecular weight for loop is used
    for j = 1:length(atomic_weight)
        if strcmp(species_name(i),element(j));
            Mw = Mw+atomic_weight(j);
            u = j;
        end
    end
    n = str2num(species_name(i));
    if n>1
        Mw = Mw + (atomic_weight(u)*(n-1));
    end
end
end
MAIN PROGRAM;
clear all
close all
clc

f1 = fopen('thermo.dat','r'); %to read the file
file_name = fgetl(f1);   %to get the first line of the file
line1 = fgetl(f1);       %to get the second line
A = strsplit(line1,' ');  %to split and converting it to string
global_min_temp = str2num(A{2}); %to convert the string as number and assigning as global minimum temperature
global_mid_temp = str2num(A{3}); %to convert the string as number and assigning as global mid temperature
global_max_temp = str2num(A{4}); %to convert the string as number and assigning as global maximum temperature

for i = 1:3
    comments = fgetl(f1)  %to get the next three lines
end

for j = 1:53
    species = fgetl(f1);
    B = strsplit(species);
    species_name = (B{1});

    line_1 = fgetl(f1);
    l1 = strfind(line_1,'E');
    a1 = str2num(line_1(1:(l1(1)+3)));
    a2 = str2num(line_1((l1(1)+4):(l1(2)+3)));
    a3 = str2num(line_1((l1(2)+4):(l1(3)+3)));
    a4 = str2num(line_1((l1(3)+4):(l1(4)+3)));
    a5 = str2num(line_1((l1(4)+4):(l1(5)+3)));

    line_2 = fgetl(f1);
    l2 = strfind(line_2,'E');
    a6 = str2num(line_2(1:(l2(1)+3)));
    a7 = str2num(line_2((l2(1)+4):(l2(2)+3)));
    a8 = str2num(line_2((l2(2)+4):(l2(3)+3)));
    a9 = str2num(line_2((l2(3)+4):(l2(5)+3)));
    a10 = str2num(line_2((l2(4)+4):(l2(5)+3)));

    line_3 = fgetl(f1);
    l3 = strfind(line_3,'E');
    a11 = str2num(line_3(1:(l3(1)+3)));
    a12 = str2num(line_3((l3(1)+4):(l3(2)+3)));
    a13 = str2num(line_3((l3(2)+4):(l3(3)+3)));
    a14 = str2num(line_3((l3(3)+4):(l3(4)+3)));

    R = 8.314;    %gas constant
    temp = linspace(global_min_temp,global_max_temp, 100); %creating an array of temperature

    mkdir('C:Usersakil bannydocumentsMATLABfile parsingspecies' ,species_name)%creating a folder

    cp = specific_heat(a1,a2,a3,a4,a5,a8,a9,a10,a11,a12,R,temp,global_mid_temp); %calling specific heat function
    h = enthalphy(a1,a2,a3,a4,a5,a6,a8,a9,a10,a11,a12,a13,R,temp,global_mid_temp); %calling entthalphy function
    s = entrophy(a1,a2,a3,a4,a5,a7,a8,a9,a10,a11,a12,a14,R,temp,global_mid_temp); %calling entrophy function

    %plotting the graph between temp vs cp
    figure(1)
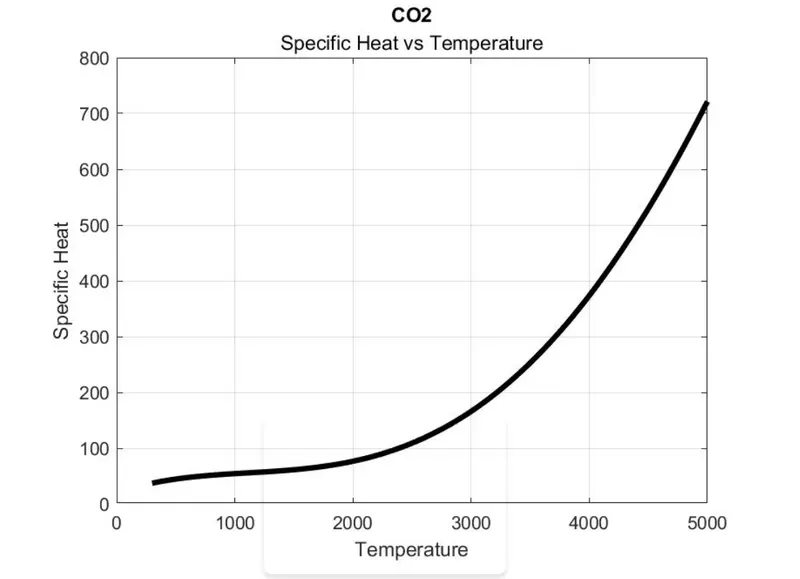
    plot(temp, cp, 'linewidth' , 3 , 'color','k');
    xlabel("temperature")
    ylabel("specific heat")
    title(species_name,'specific heat vs temperature')
    grid on

    %plotting the graph between temp vs enthalphy
    figure(2)
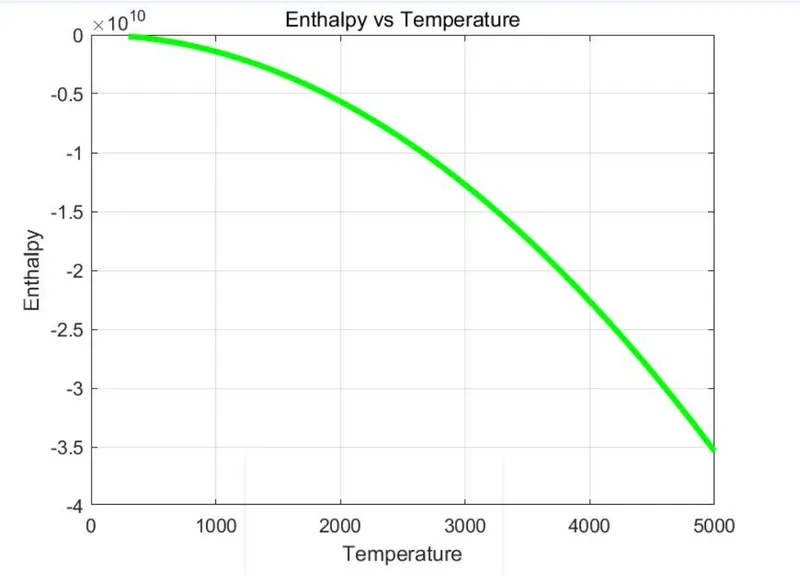
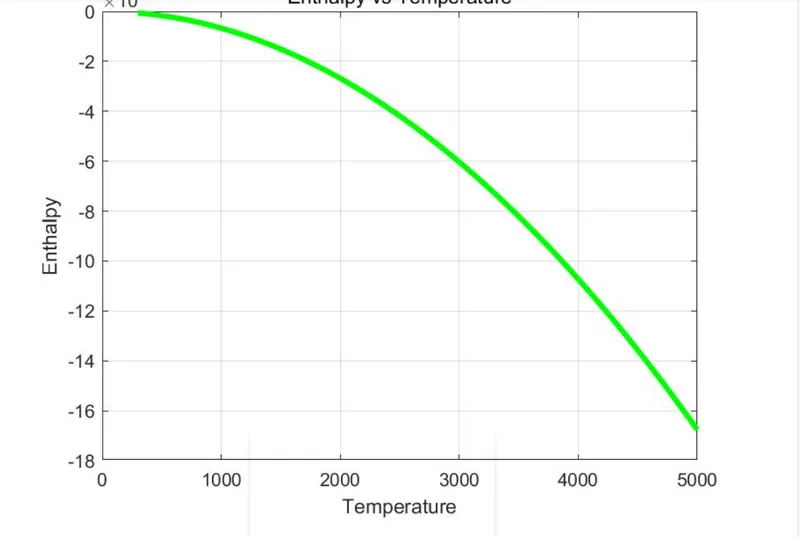
    plot(temp,h, 'linewidth',3,'color','g');
    xlabel("temperature")
    ylabel("enthalphy")
    title(species_name,'enthalphy vs temperature')
    grid on

    %plotting the graph betweeen temp vs entropy
    figure(3)
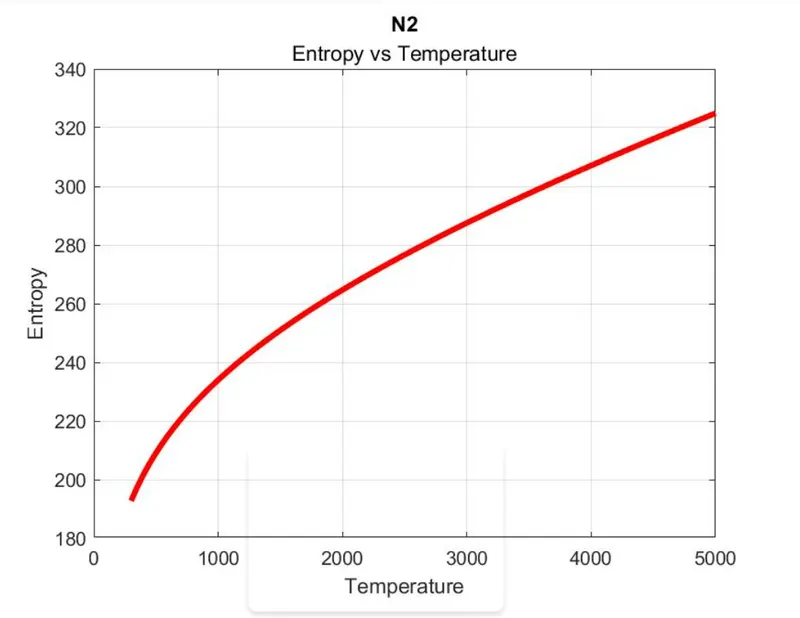
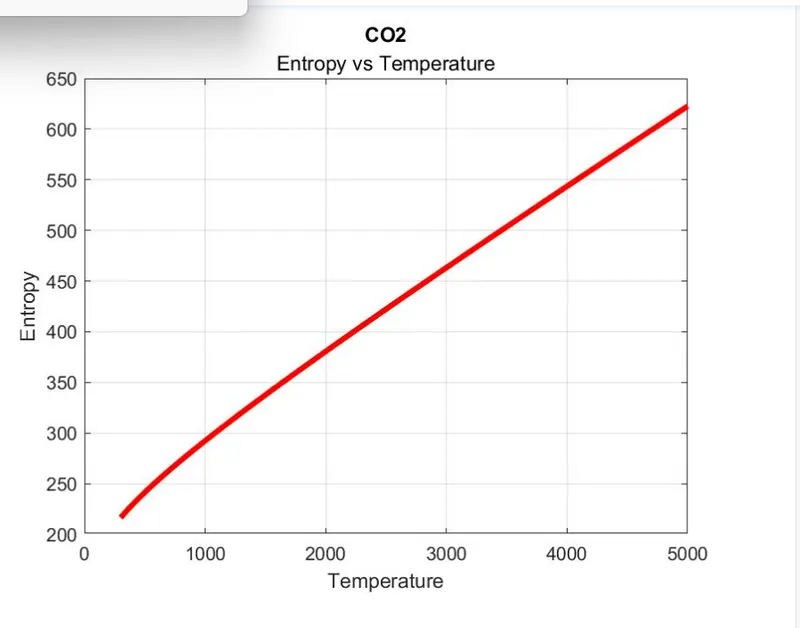
    plot(temp,s, 'linewidth',3, 'color','r');
    xlabel("temperature")
    ylabel("entrophy")
    title(species_name,'entrophy vs temperature')
    grid on

    %creating folders for specific species name
    program = (['C:Usersakhil bennydocumentsMATLABfile prasingspecies',species_name]);
    cd(program)

    %saving the figure
    saveas(figure(1),'specific heat.jpg')
    saveas(figure(2),'enthalphy.jpg')
    saveas(figure(3),'entrophy.jpg')

    cd('C:usersakhil bennydocumentsMATLABfile parsing')

    Mw = molecular_weight(species_name);
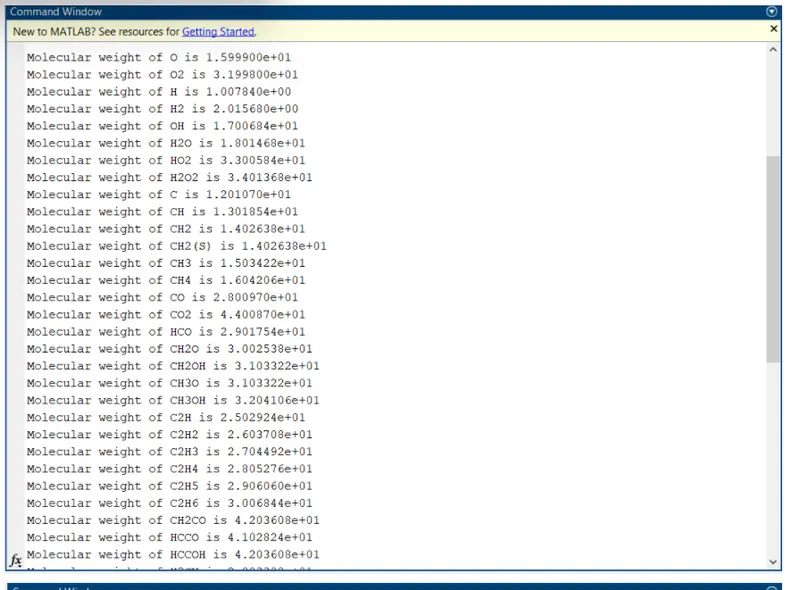
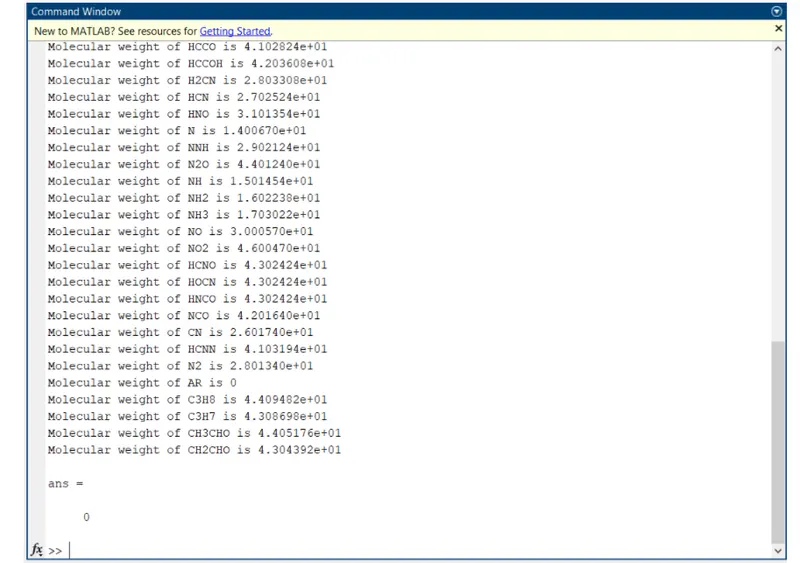
    fprintf('molecular weight of %s is %d',species_name,Mw); %to print the molecular weight of each element
    disp(' ')
end
fclose(f1)
PROGRAM EXPLANATION:
*The program is started with fopen command to read the data file.it is used to open the file and here 'r' is used to read the data file
*Then using the fgetl command the lones in the data file are get in the program
*The three main global temperature were given in the second line in the data file those temperatures were get in the command and assigned it as global min,mid,max temperature.
*Then using for loop the further operations were carried out
*there are 53 species in the total and each species has 14 coefficient under them
*14 coefficient were etracted in the main program and 3 function programs were written to calculate specific heaat,enthalphy,entropy for all the species in the data file.first 7 coefficients are hight-temperatre coefficient and second 7 coefficient were low-temperature coefficients.
*and those function program were called in the main program.
*graph were plotted for all the species of Cp vs T, h vs T, s vs T and all the graphs were saved using saveas commmand
*All the plots were saved as images with approximate names and dump them in separate folders for each species with suitable name .all these should be generated automatically
*abother function program is written to calculate molecular weight for all the 53 species
*The function program is called in the main program and molecular weight of the species were displayed in the command window
*strsplit command is used to split the group of words into seperate words
*str2num command is used to convert the string into numbers for further operations
*strfind command is used to find a letter in the line
*mkdir command is used to make a new floder
*saveas command is used to save the plots as images
ERRORS FACED
*Errors were faced during saving the plots as image and rectified later
*Errors were faced during calling the function
*semi colons were missed in some lines
RESULT
O2
N2:
CO2:
SNAPSHOT OF COMMAND WINDOW:
REFFERENCES:
hhttps://in.mathworks.com/help/matlab/ref/saveas.html
https://in.mathworks.com/matlabcentral/answers/403782-how-can-i-save-multiple-plots-in-a-specified-folder