Project
AIM:
To prepare a technical report of simulation of BAJA All- Terrain Vehicle(ATV) under different conditions.
OBJECTIVES:
Carry out a system level simulation of an all terrain vehicle and prepare a technical report explaining the model properties and comment on the result. The models which need to be studied are:
- Study the baja ATV model without dashboard.
- Study the baja ATV model with dashboard
- Study the baja ATV model using lookup table without dashboard.
- Study the baja ATV model using lookup table with dashboard.
INTRODUCTION:
An all terrain vehicle is defined as a motorized off highway vehicle designed to travel on four low pressure or non pneumatic tires, having a seat designed to be straddled by the operator and handlebars for steering control.
STUDY1:
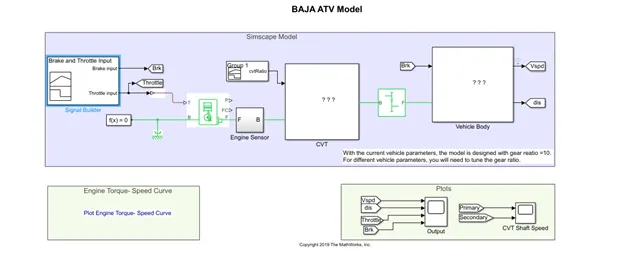
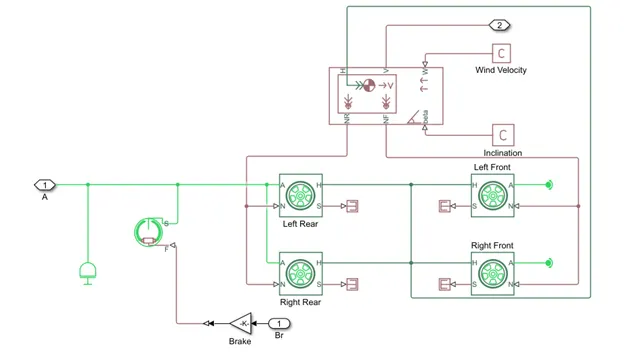
The BAJA ATV model consists of the signal builder, generic engine, motion sensors, vehicle transmission, vehicle body, and tires. The initial engine speed is given as 2100rpm, mechanical rotation for driven pulley and driver pulley as 0.8 and 0.7 respectively. The mass of the vehicle is 250Kg.
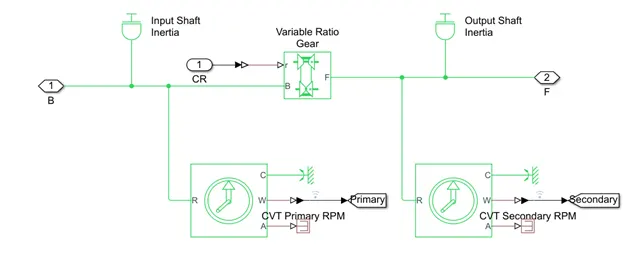
CVT SUBSYSTEM:
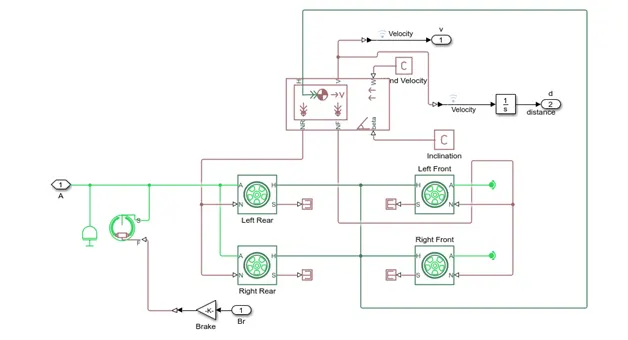
VEHICLE BODY:
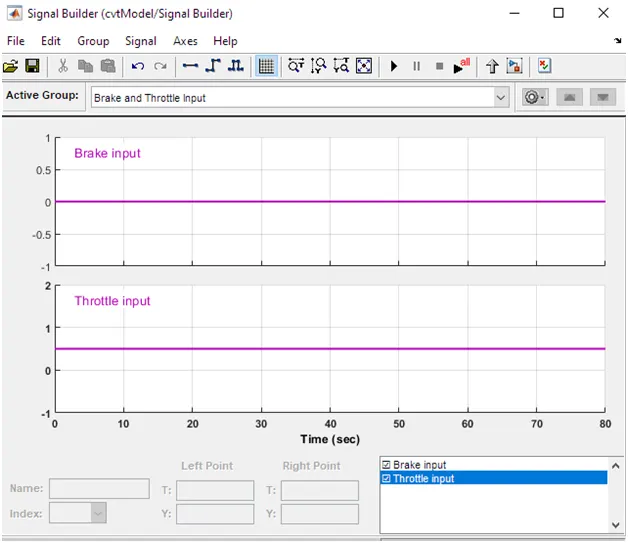
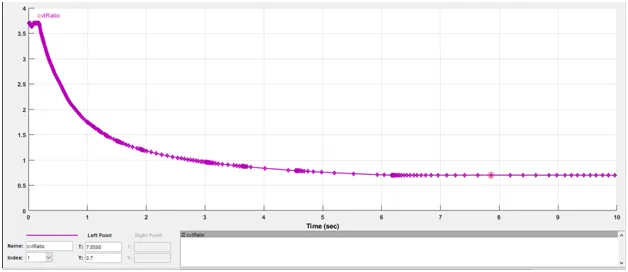
The signal builder is used as input for brake, throttle. Brake input is maintained as 0 for overall solution. The throttle input is given as 0.5 for overall simulation. The throttle value is mainly to control the flow or amount of fuel into the engine. The gear ratio is maintained as 3.7 and linearly decreases to 0.7 and maintained constant for overall simulations.
STUDY 2:
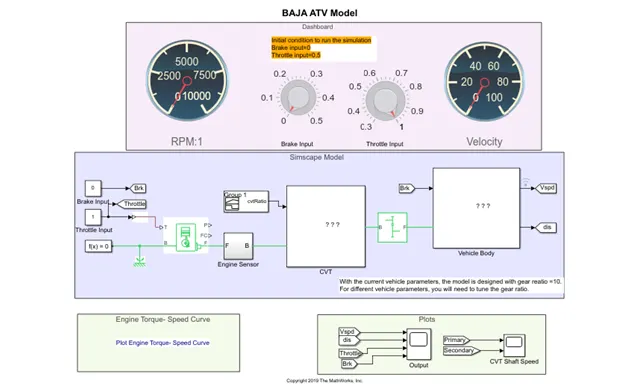
The above figure shows Baja ATV with dashboard model which consist throttle meter and brake input in the dashboard instead of giving input through the signal builder. The main concept of using the dashboard is to study the result by varying the input of brake and throttle which shows that the velocity and the speed of the engine. The gear ratio is maintained as 3.7 and linearly decreases to 0.7 and maintained constant for overall simulations. As the brake input varies from 0-0.5 the velocity and speed decreases accordingly. By increasing the throttle, the velocity and speed of the engine and shaft increases.
STUDY 3:
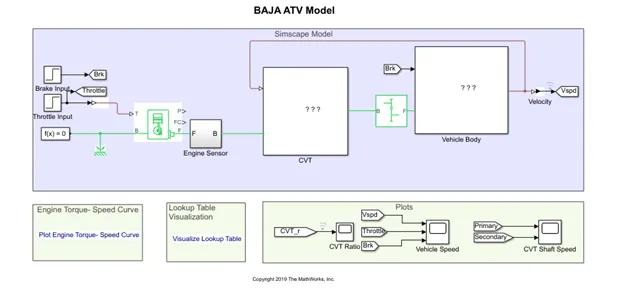
The BAJA ATV model consists of the signal builder, generic engine, motion sensors, vehicle transmission, vehicle body, and tires. The initial engine speed is given as 2100rpm, mechanical rotation for driven pulley and driver pulley as 0.8 and 0.7 respectively. The mass of the vehicle is 250Kg.
A lookup table is an array of data that maps input values to output values, thereby approximating a mathematical function. Given a set of input values, a lookup operation retrieves the corresponding output values from the table.
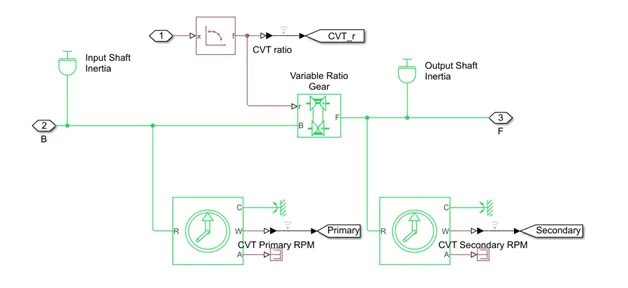
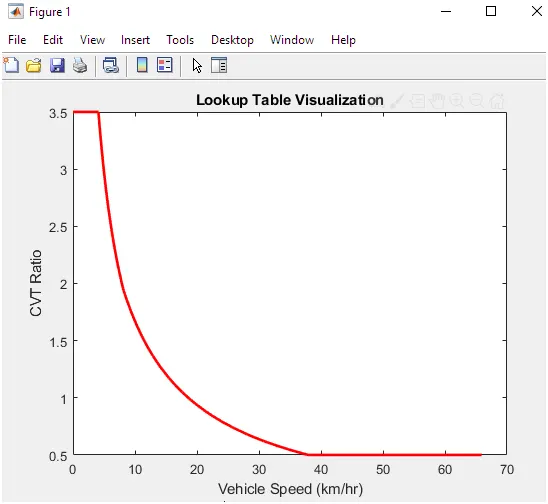
The brake input and the throttle input is given by step time which depends on the run time and varies accordingly. Using the lookup table for gear ratio which takes as input to the CVT. The gear ratio varies from 3.5 to 0.5 as taken as input and output in terms of velocity. The maximum speed is 67 kmph.
CASE 4:
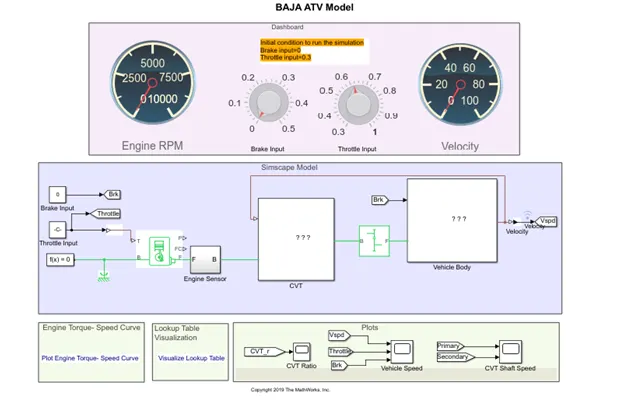
The above figure shows the Baja ATV with dashboard model using the lookup table which consists throttle meter and brake input in the dashboard and indicated as constant block. All the other blocks are similar to the baja ATV model without dashboard. The main concept of using dashboard is to study the result by varying the input of brake and throttle, which shows the variation of velocity and speed of the engine.
OUTPUT:
STUDY 1 – Variation of Velocity and Shaft Speed:
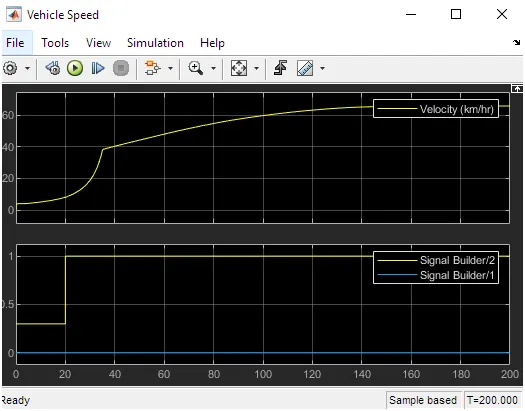
The brake is maintained as constant and by increasing the throttle increases the velocity. The fuel flow increases when the throttle increases from 0.3 to 1, thus the power in the engine increases.
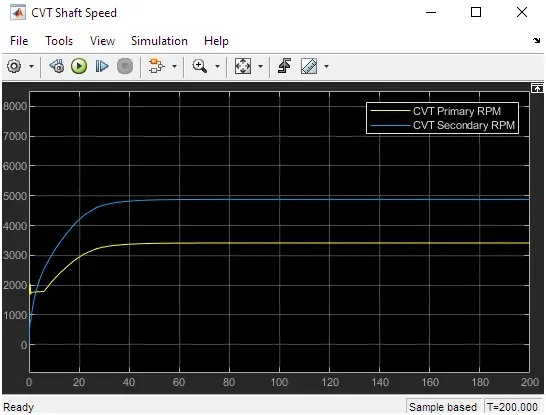
In the above figure, the primary shaft reaches high speed and secondary shaft as low rotational speed because the radius of the primary shaft as more than the secondary shaft, the speed is directly proportional t the radius of the shaft. As the radius increases, the speed of the shaft also increases.
STUDY 2: Variation of Velocity and Speed
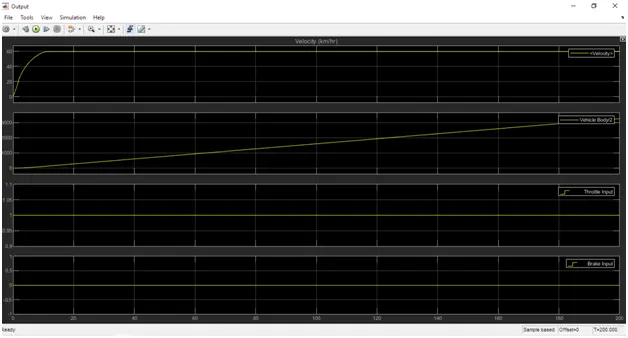
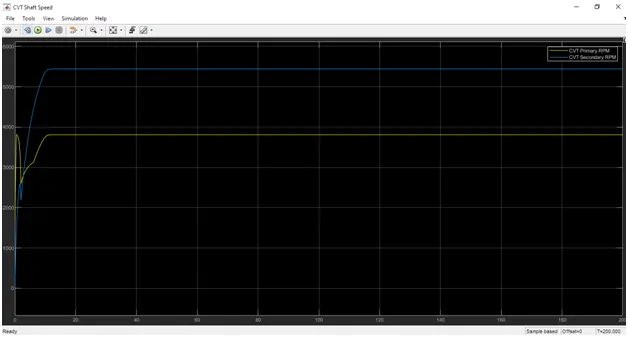
The primary shaft speed increases by increasing the throttle and decreasing by increasing the brake input value and remains constant after certain time period. As the radius increases, the speed of the shaft increases.
STUDY 3: Variation of Velocity and Shaft Speed:
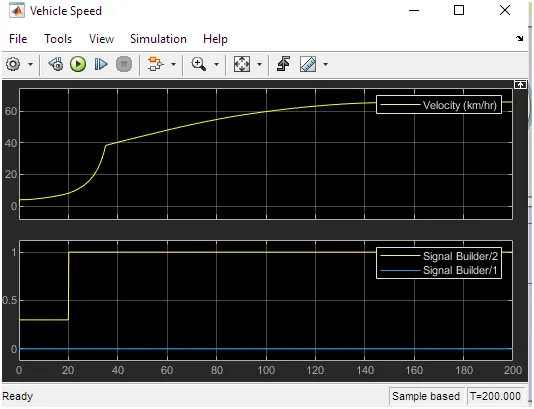
In the above figure, the brake is maintained as constant and increase in throttle which shows increase in velocity. The fuel flow increases when the throttle increases from 0.3 to 1, thus the power in the engine increases.
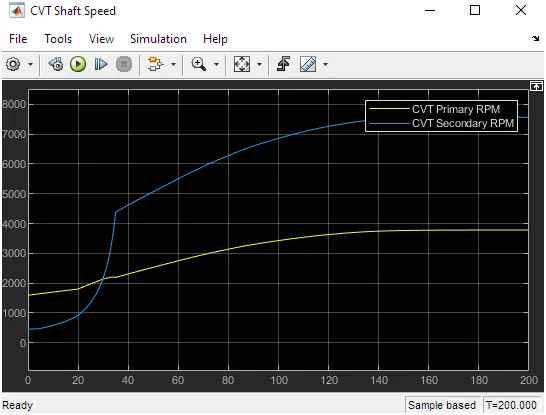
In the above figure, the primary shaft speed increases by increasing throttle and decreasing the brake input value, which defines the throttle can flow more amount of fuel which increases the power of the engine and similar to the secondary shaft. As the radius increases, the speed of the shaft also increases.
CONCLUSION:
- As the throttle speed increases, the velocity increases which in turn increases the power.
- As the gear ratio increases, the torque increases and the velocity decreases.
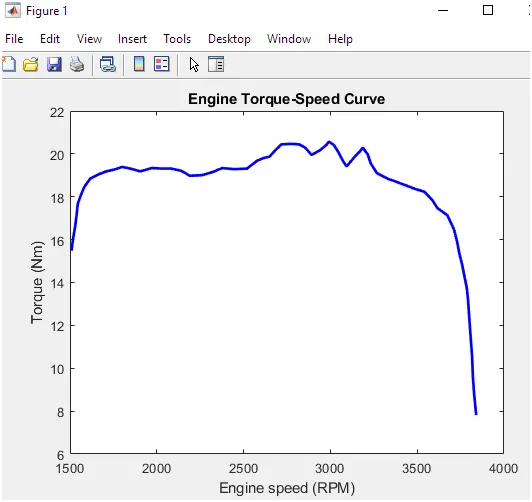
In above figure, the torque is increased by increasing the engine speed. At a particular point the torque is decreasing when the gear ratio increases in order to achieve maximum velocity.
The velocity is varying with the gear ratio. For high gear ratio, the torque is more which decreases the velocity.
- With the help of lookup table, the input value can be varied and the output value by using the interpolation and extrapolation method.