Project
Objective:
To carryout a system-level simulation of an all-terrain vehicle"BAJA-ALL-TERRAIN-VEHICLE-ATV-MODEL" and to create a technical report explaining model properties and simulation results in different condtions.
"BAJA_ALL_TERRAIN_VEHICLE_ATV_MODEL" explanation:
The following report explaining different conditions and different input values such as lookup tabe, cv ratio having value provided of throtle and break value by signal builder and then by dashboard.
1. TYPES OF MODEL:
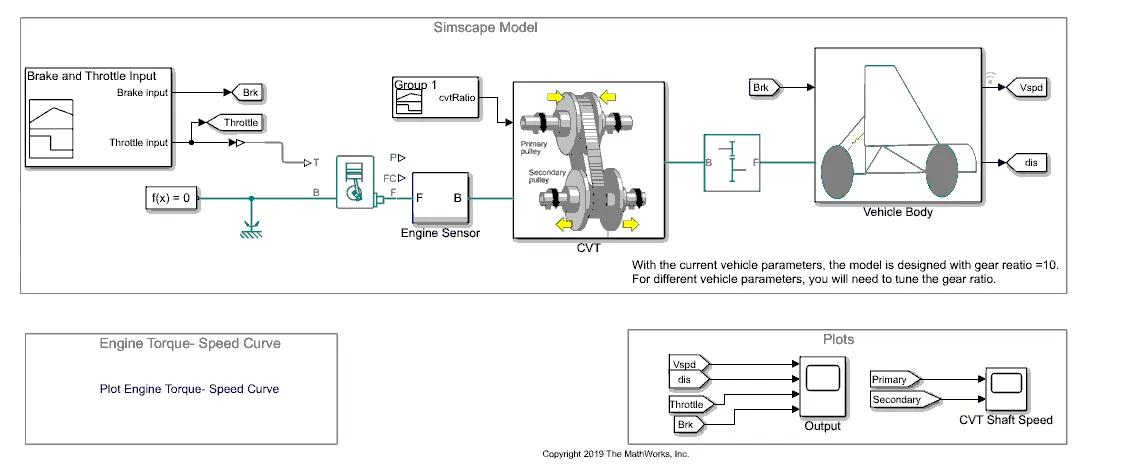
1.a. CVT MODEL
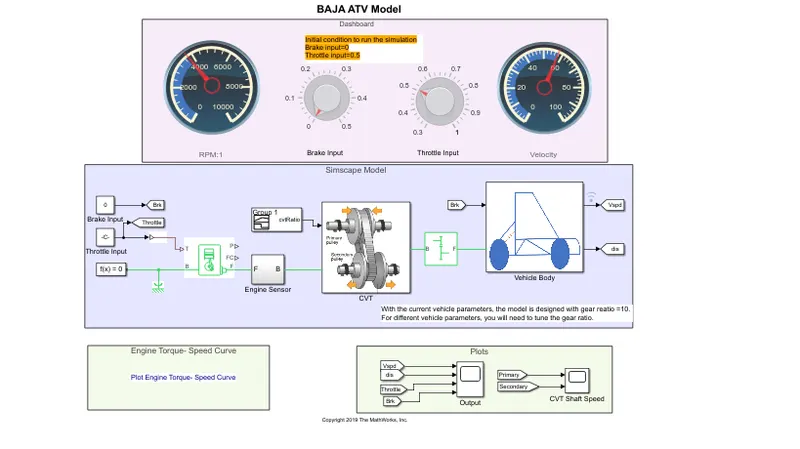
1.b. MODEL WITH DASHBOARD
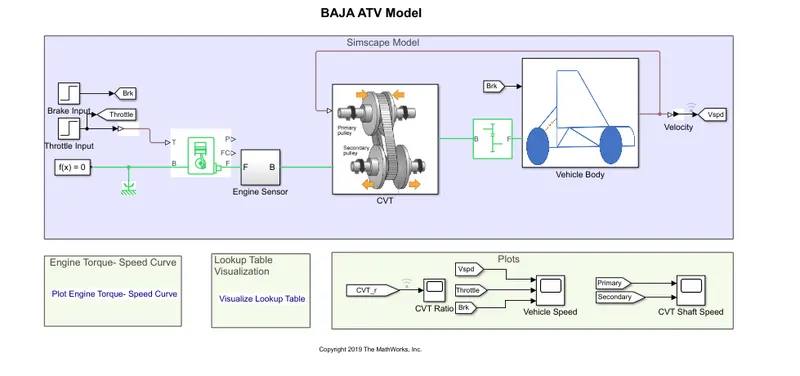
1.c. MAPPED CVT MODEL
2. BLOCKS USED:
2.a. Vehicle Body
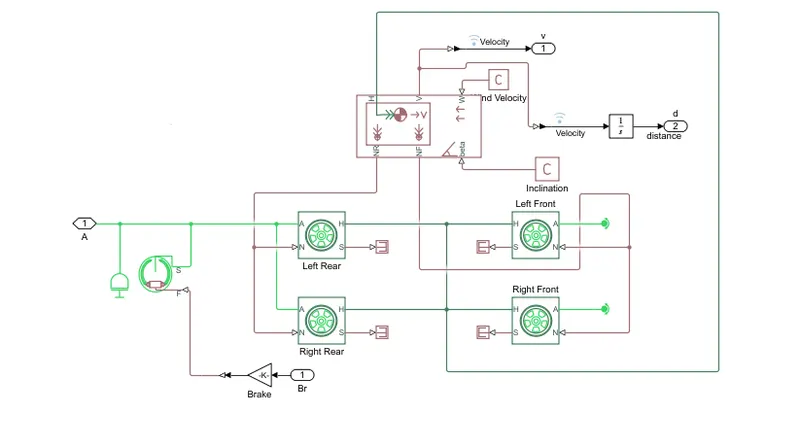
Following Image showing Block of vehicle body.
2.b. Engine Sensor
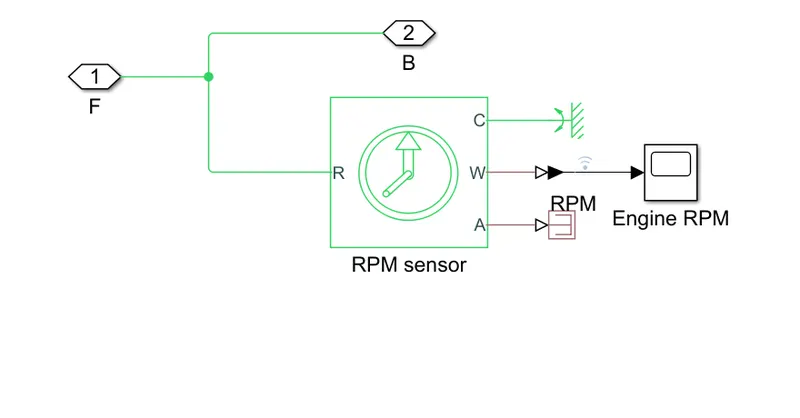
Following block shows block of Engine block which measures engine RPM.
2.c. CVT
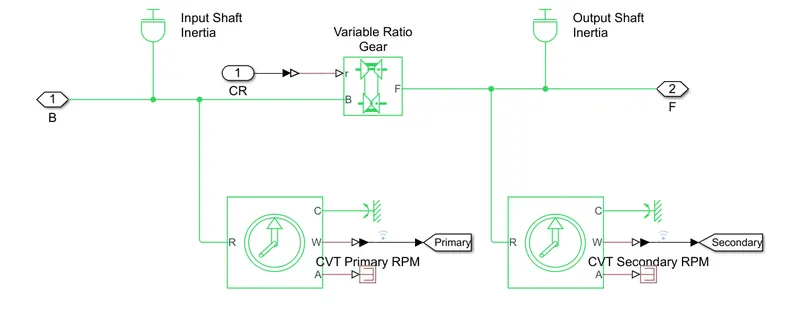
Following block shows CVT block.
3. Generic Engine:
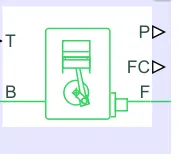
Following image shows generic engine in which values are being fed according to the conditions requiered.
4.Inputs Provided
4.a Brake and throtle inputs:
Brake and throtle inputs are provided through signal generator in which brake inout is zero and throtle input is 0.5.
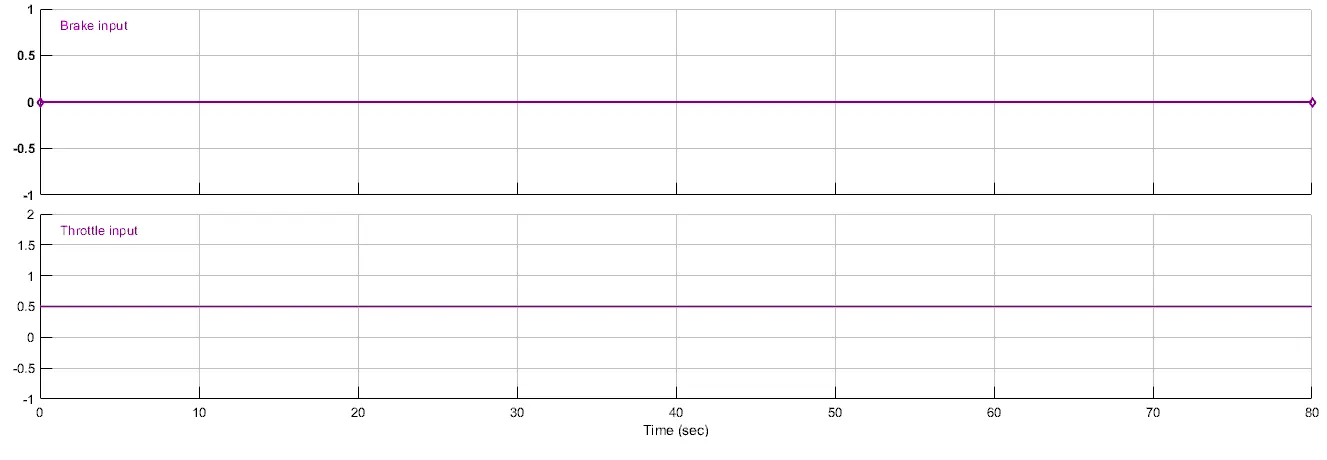
4.b. Brake and throtle input is provided through step time signal.
4.c. Input Brake and Throtle is provided trough dashboard.
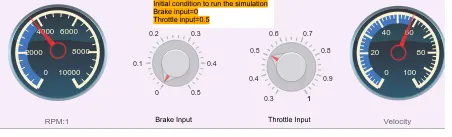
In this variable input or real time situation can be simulated as canvary breake input and throtle input.
Observation:
1. CVT Model with input and output given through Signal generator:
In this the brake and throtle signal given to generic engine is through signal generator.
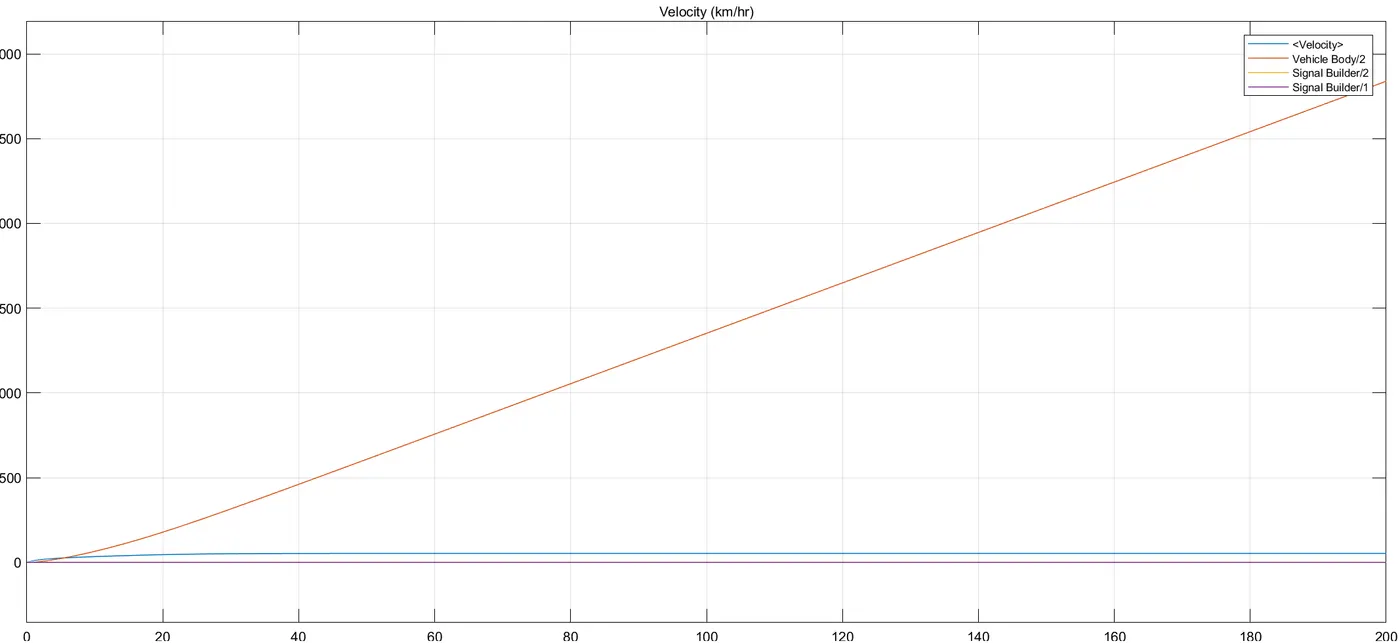
From the above graph it can be observed that barke is having value zero and throtle is 0.5. It can be seen that velocity of vehicle increases lineraly then increases linearly for a short period of time and then became constant but displacement increases linearly for whole time.
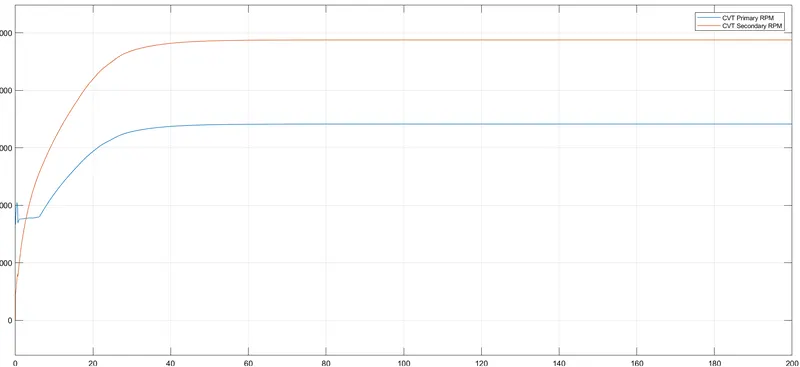
Form the above grpah showing CVT Primary and secondary RPM respectively. Primary RPM is less than Secondary RPM.
2. CVT Model input and output given from dashboard:
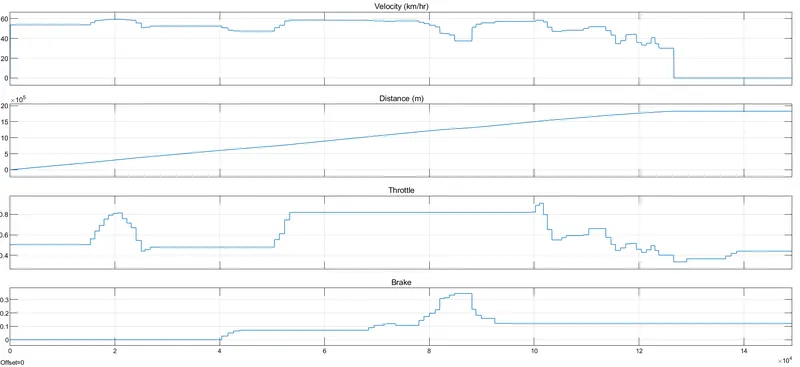
Above graph shwoing throttle and brake of different value and its impact on velocity as well as distance respectively.
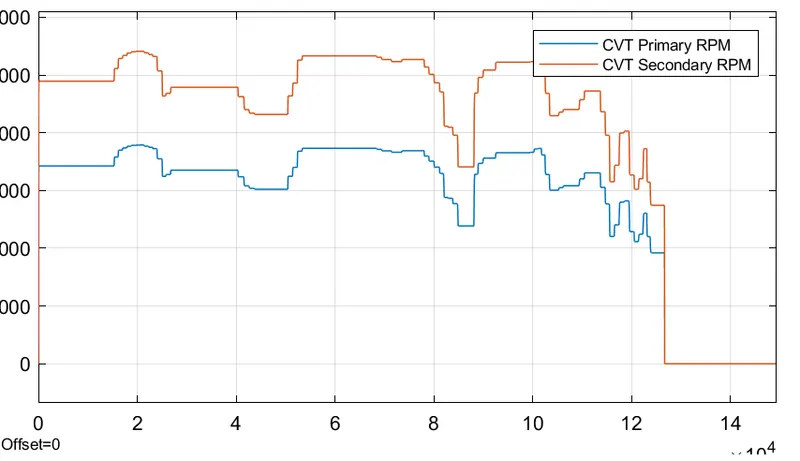
Above graph showing the primary and secondary RPM values.
3. CVT Model input and output given from dashboard(input given by lookup table):
1.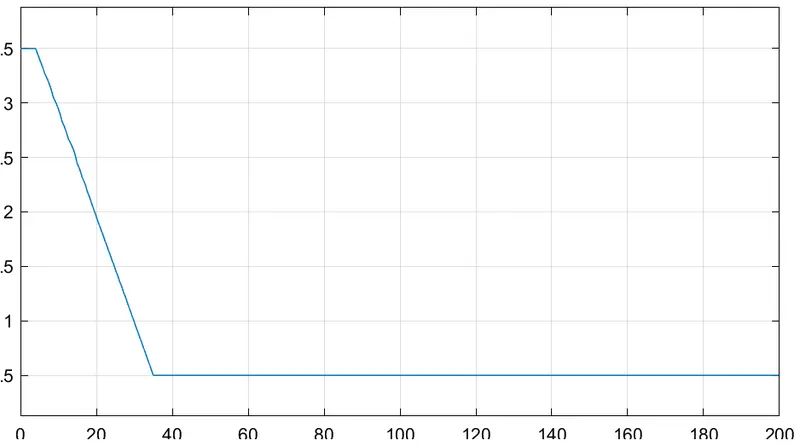
Above graph shows CVT ratio of model.
2.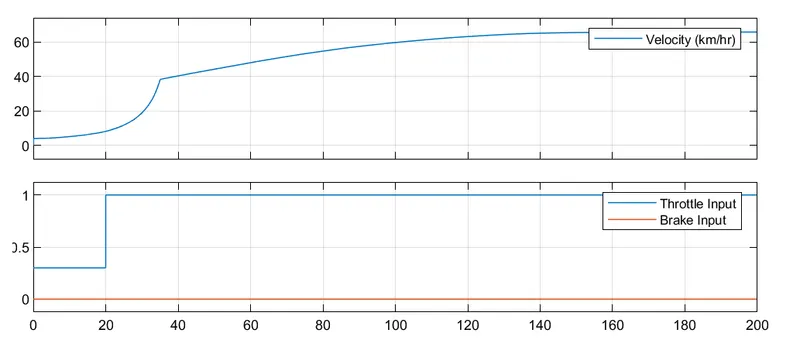
Above image shows Velocity and Throttle Input and brake input given during simulation
3.
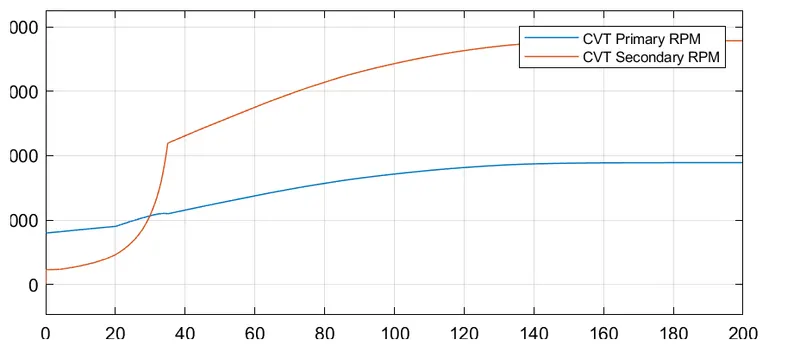
Above image shows speed of shaft as Primary and Secondary shafts respectively.
4.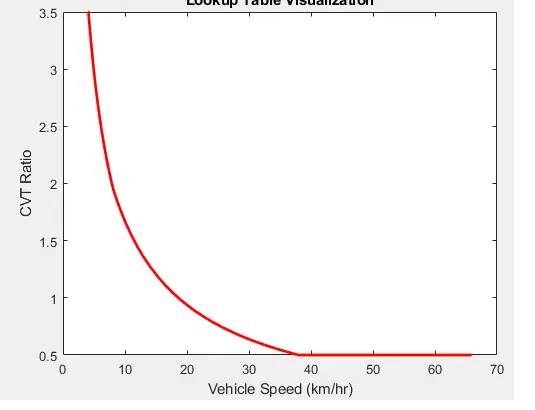
Above image shows CVT ratio vs Vehicle speed in km/hr.
Conclusion:
System level simulation of ATV-"All terrain vehicle" has been done successfully.