Project 2 Thermal modeling of battery pack
AIM - To study about the Thermal Modelling Of Battery Packs.
OBJECTIVE - For a 10 cell series lithium ion battery model, we have to simulate the thermal effects and compare life cycle performance at various temperatures, charge & discharge rates using MATLAB.
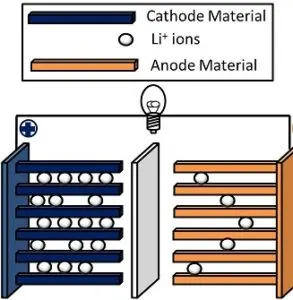
Theory - A lithium-ion battery or Li-ion battery is a type of rechargeble battery in which lithium ion move from the negative electrode through an electrolyte to the positive electrode during discharge, and back when charging. Li-ion batteries use an intercalated lithium compound as the material at the positive electrode and typically graphite at the negative electrode.
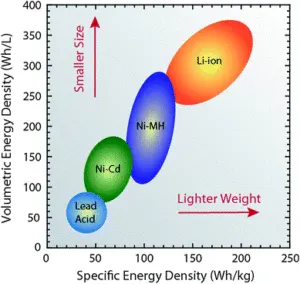
A diagram of the Specific Energy Density and Volumetric Energy Density of various battery types -
Advantages Of Li-ion Battery -
1).Lithium ion battery have the highest energy densities of any battery technology (100-265 Wh/kg or 250-670 Wh/L).
2).Li-ion battery cells can deliver up to 3.6 Volts, 3 times higher than technologies such as Ni-Cd or Ni-MH. This means that they can deliver large amounts of current for high-power applications, which has Li-ion batteries are also comparatively low maintenance, and do not require scheduled cycling to maintain their battery life.
3).Li-ion batteries also have low self-discharge rate of around 1.5-2% per month.
4).They do not contain toxic cadmium, which makes them easier to dispose of than Ni-Cd batteries.
Disadvantage Of Lithium ion battery -
1). Li-ion batteries have a tendency to overheat, and can be damaged at high voltages.
2). Li-ion batteries require safety mechanisms to limit voltage and internal pressures, which can increase weight and limit performance in some cases.
3).Li-ion batteries are also subject to aging, meaning that they can lose capacity and frequently fail after a number of years.
4). Another factor limiting their widespread adoption is their cost, which is around 40% higher than Ni-Cd. Addressing these issues is a key component for current research into the technology.
Simulink Model Of Lithium Ion Battery -
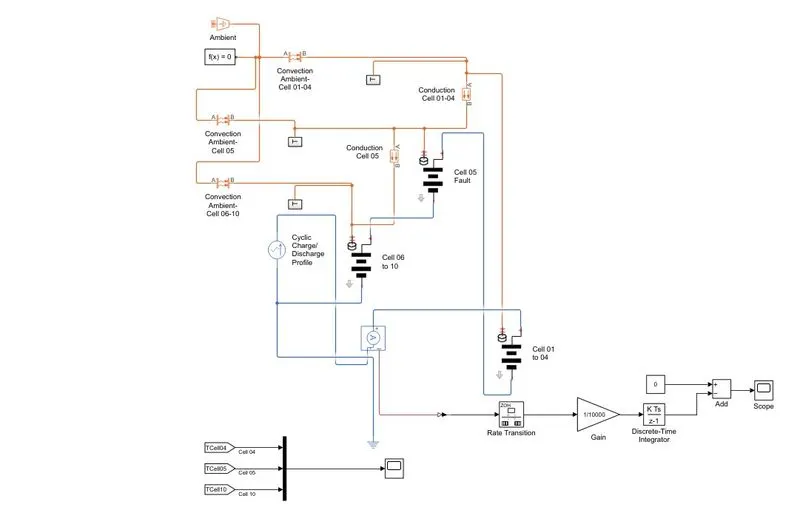
Block Explanation -
1). In the above battery pack model 10 cells are connected in series.
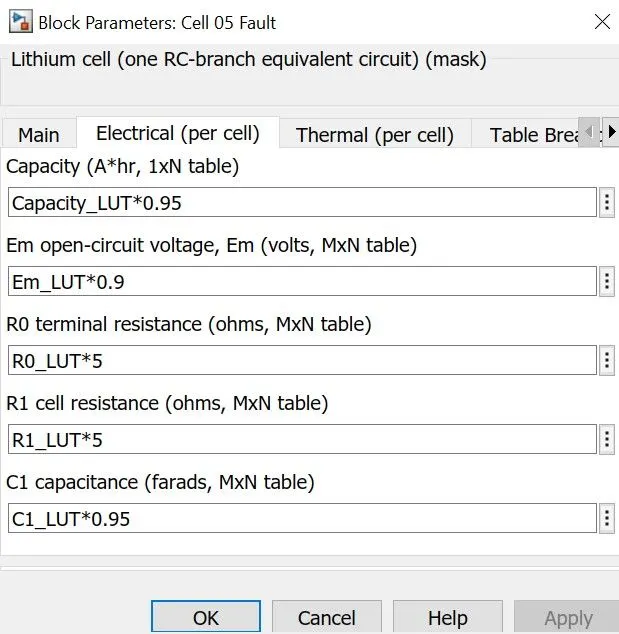
2) . Cell 5 is used as Fault cell for temperature change within battery cell.
Subsystems -
Cell 1 to 4 subsystem -
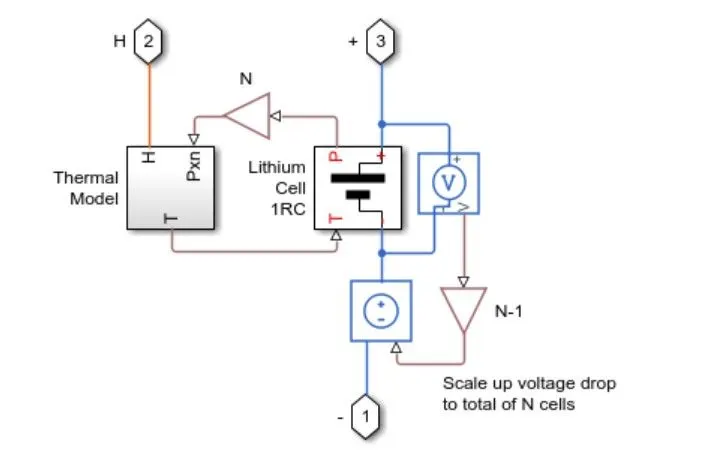
Lithium Cell 1 RC Subsystem -
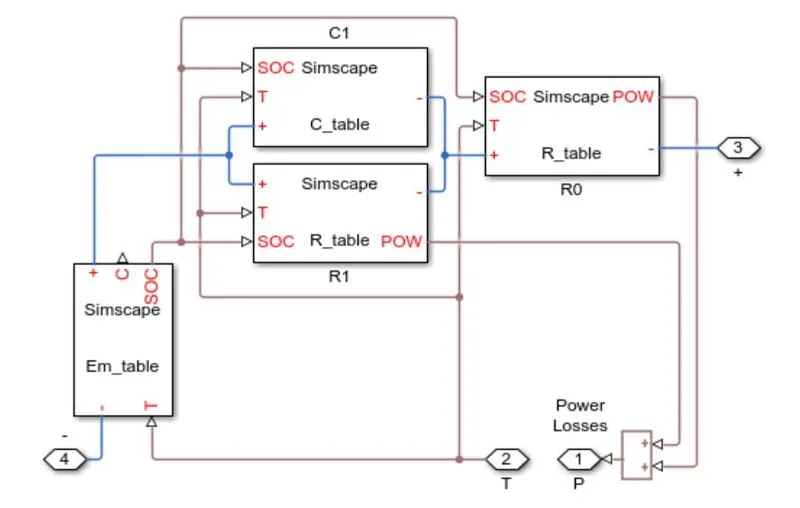
Blocks Used -
1). Temperature Source Block -
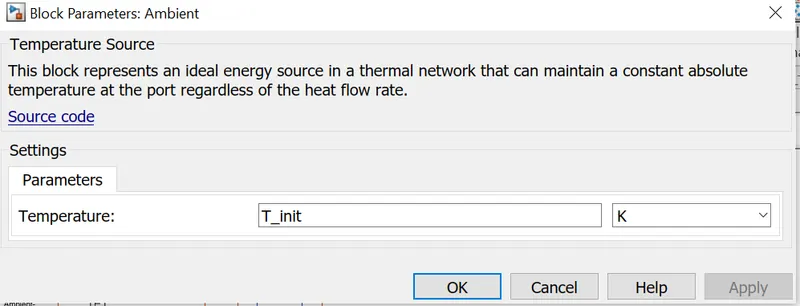
The Temperature Source block represents an ideal source of thermal energy that is powerful enough to maintain specified temperature at its outlet regardless of the heat flow consumed by the system.
The source generates constant absolute temperature, defined by the Temperature parameter value.
2). Convective Heat transfer Block -
The Convective Heat Transfer block represents a heat transfer by convection between two bodies by means of fluid motion. The transfer is governed by the Newton law of cooling and is described with the following equation:
Q=k·A·(TA−TB)
where
| Q | Heat flow |
| k | Convection heat transfer coefficient |
| A | Surface area |
| TA,TB | Temperatures of the bodies |
Connections A and B are thermal conserving ports associated with the points between which the heat transfer by convection takes place. The block positive direction is from port A to port B. This means that the heat flow is positive if it flows from A to B.
3). Conductive Heat Transfer Block -
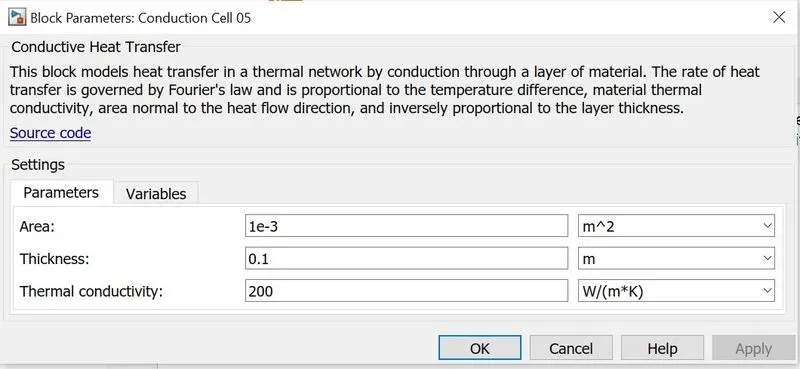
The Conductive Heat Transfer block represents a heat transfer by conduction between two layers of the same material. The transfer is governed by the Fourier law and is described with the following equation:
Q=k·AD(TA−TB)
where
| Q | Heat flow |
| k | Material thermal conductivity |
| A | Area normal to the heat flow direction |
| D | Distance between layers (thickness of material) |
| TA,TB | Temperatures of the layers |
Connections A and B are thermal conserving ports associated with material layers. The block positive direction is from port A to port B. This means that the heat flow is positive if it flows from A to B.
4). Temperature Sensor Block -

The Temperature Sensor block represents an ideal temperature sensor, that is, a device that determines the temperature differential measured between two points without drawing any heat.
Connections A and B are thermal conserving ports that connect to the two points where temperature is being monitored. Port T is a physical signal port that outputs the temperature differential value.
The block positive direction is from port A to port B. The measured temperature is determined as T = TA – TB.
5).AC Current Source -

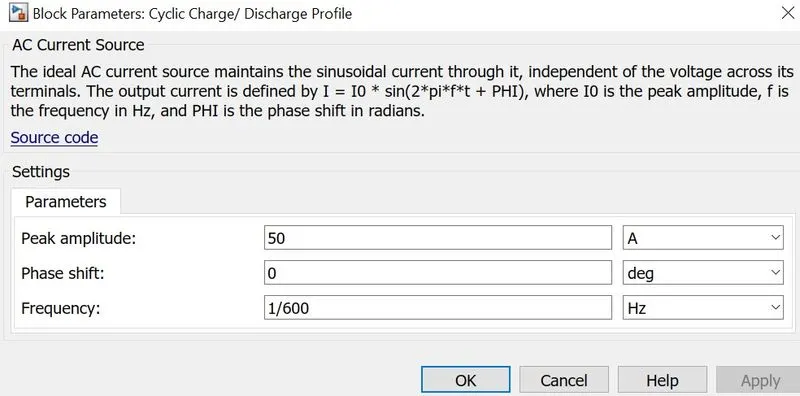
The AC Current Source block represents an ideal current source that maintains sinusoidal current through it, independent of the voltage across its terminals.
The output current is defined by the following equation:
I=I0⋅sin(2π⋅f⋅t+φ)
where
| I | Current |
| I0 | Peak amplitude |
| f | Frequency |
| φ | Phase shift |
| t | Time |
The positive direction of the current flow is indicated by the arrow.
6). Current Sensor -
The Current Sensor block represents an ideal current sensor, that is, a device that converts current measured in any electrical branch into a physical signal proportional to the current.
Connections + and – are electrical conserving ports through which the sensor is inserted into the circuit. Connection I is a physical signal port that outputs the measurement result.
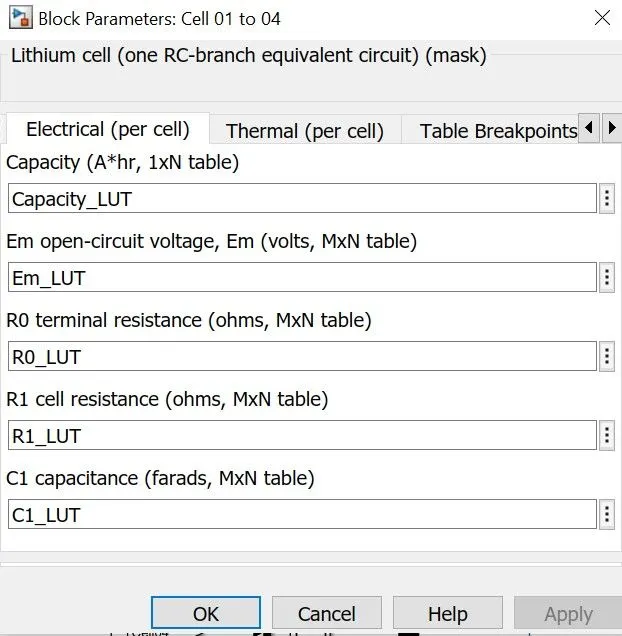
Block Parameter -
For Cell 1 to 4 -
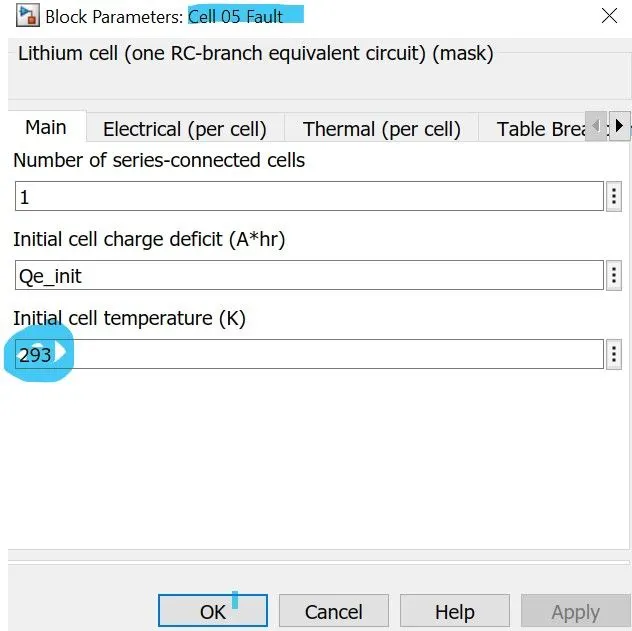
Block parameter cell 5 -
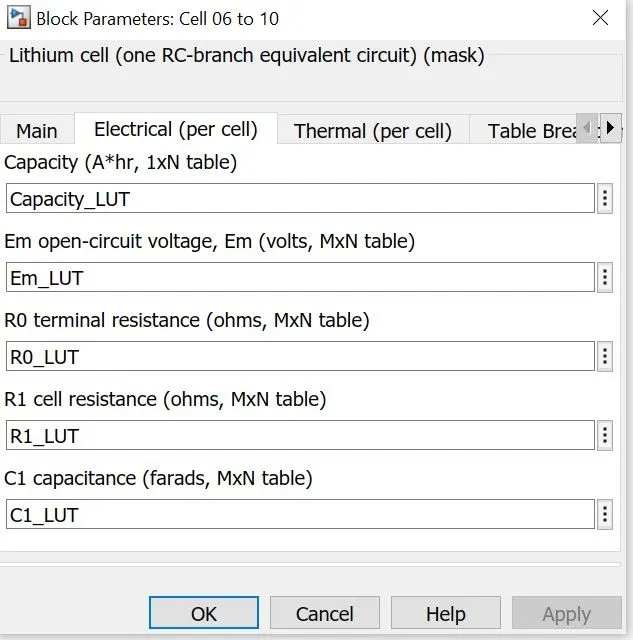
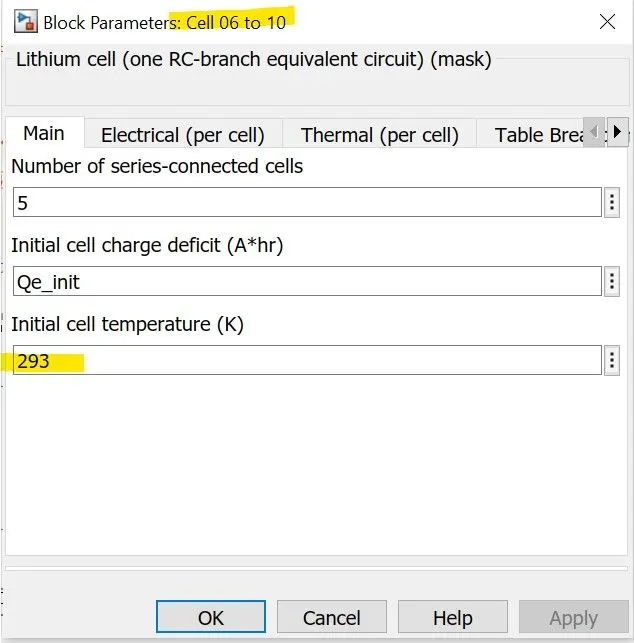
Block Parameter cell 6 to 10 -
Thermal Effect And life Cycle Performance -
Test 1 ) For Equal Temperature - (293 K) -
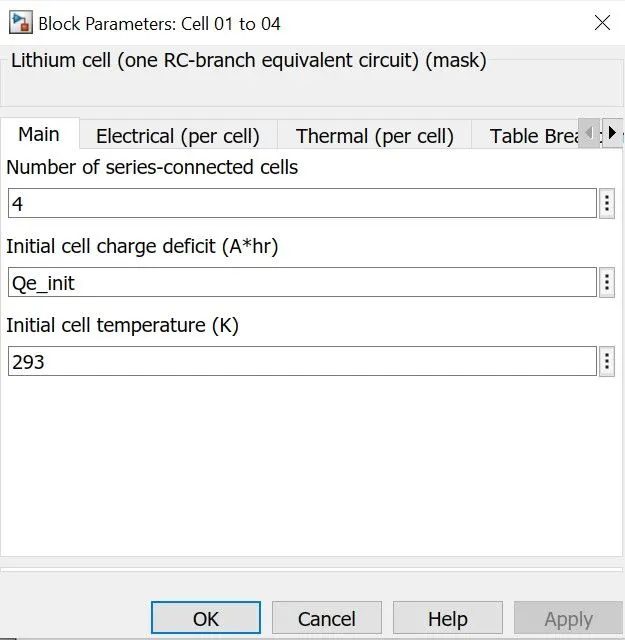
For Cell 1 to 4 -
For cell 5 Fault -
For cell 6 to 10 -
RESULT -
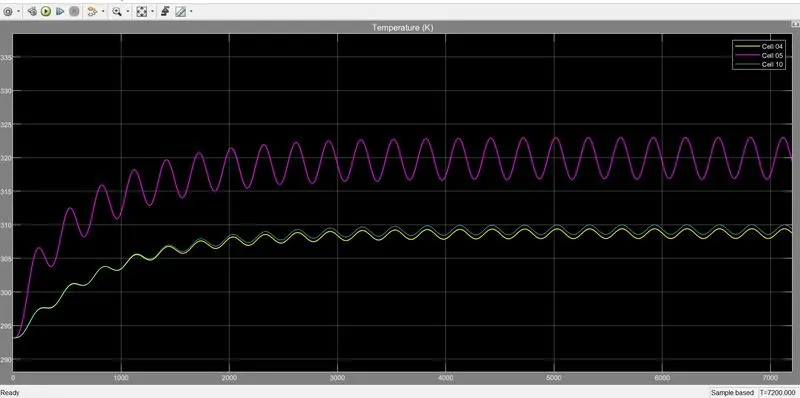
OBSERVATION -
- In the above graph we have taken the same temperature value for all the cell as 293K .
- The value of Ambient temperature is also 293K .
- The temperature of fault cell (5) has increases from 293 K to 327 K .
- Till 1200 sec the temperature value of 4 cell and 10 cell are equal .
- After 1200 sec the temperature of 10 cell increases as it has more cell coonected in series .
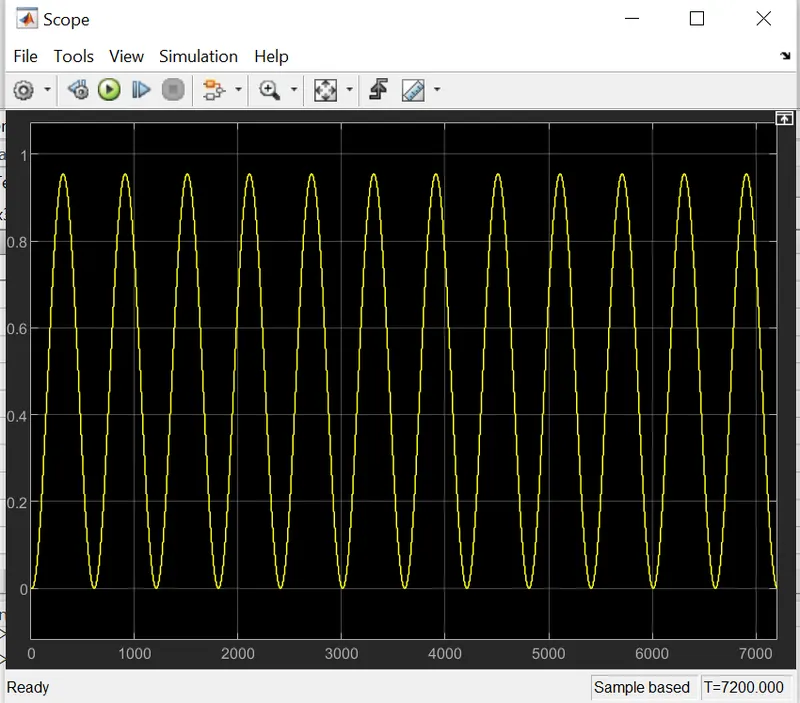
Conclusion -
SOC of the battery reaches to its maximum value from 0 to 400 seconds i.e. 0.95 and after 400 seconds it reaches to 0 again , and in this way cycle repeats again and again .
Test 2 -
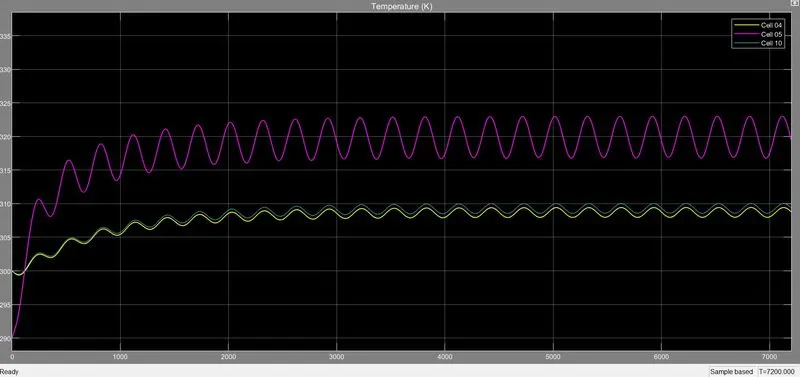
When Cell 5 temperature is 290 K and Cell 4 and Cell 10 temperature is 300 k .
RESULT -
Observation -
We observe that initially the temperature of cell 4 and 10 are maximum than the cell 5 temperature, but overall rise of temperature of cell 5 is greater than the other two cell. It has achieve the maximum value of 323 K due to fault condition .
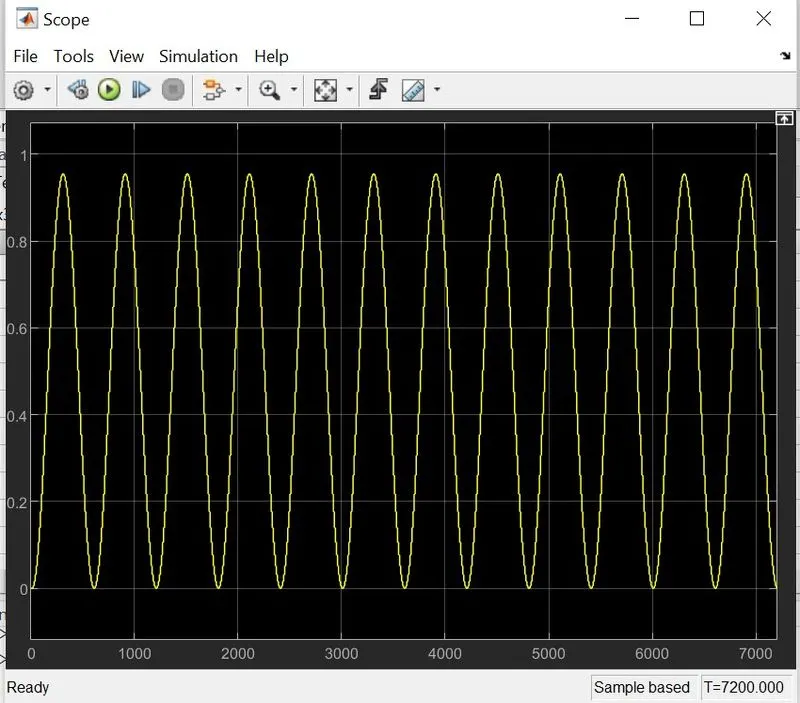
SOC of the battery reaches to its maximum value from 0 to 400 seconds i.e. 0.95 and after 400 seconds it reaches to 0 again , and in this way cycle repeats again and again .
TEST 3 -
When all the cell have different temperature , i.e. cell 5 is at 320 K and cell 4 is at 305 K and cell 10 is at 310 k .
RESULT -
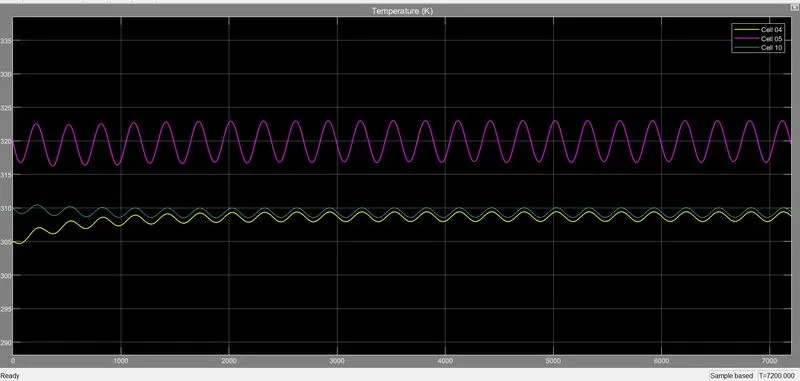
SOC of the battery reaches to its maximum value from 0 to 400 seconds i.e. 0.95 and after 400 seconds it reaches to 0 again , and in this way cycle repeats again and again .
CONCLUSION -
- Life cycle performance of battery has been analysed at various temperatures.
- Charge and discharged rate also analysed .