Project 2 Thermal modeling of battery pack
Modelling of a lithium ion battery :
The performance and life-cycle costs of electric vehicles (EV) and hybrid electric vehicles (HEV) depend inherently on energy storage systems such as batteries. Battery pack performance directly affects the all electric range, power for acceleration, fuel economy, and charge acceptance during energy recovery from regenerative braking. Because the battery pack cost, durability, and life also affect the cost and reliability of the vehicle, any parameter that affects the battery pack must be optimized.
Temperature and temperature uniformity have a strong influence on battery pack performance and consequently, that of HEVs and EVs. All the modules in the pack should be operated within the optimum temperature range suitable for the particular electrochemical couple used. In addition, uneven temperature distribution in a pack leads to different charge/discharge behaviour that results in unbalanced modules and reduced pack performance . Because HEV batteries have high specific power and undergo aggressive HEV charging/discharging profiles, thermal issues in an HEV pack are of more concern than in EV packs.
In this project will simulate the thermal effect of a 10S1P lithium-ion battery pack,which consist of 10 ANR26650m1-B high-performance Nanophosphate lithium iron phosphate (LiFePO4) battery technology delivers high power and energy density combined with excellent safety performance and extensive life cycling in a lighter weight, more compact package. to make its interesting,a fault has been introduced in one of the cell to demonstate the effect of the faulty cell on the entire pack.
Simulink Model :
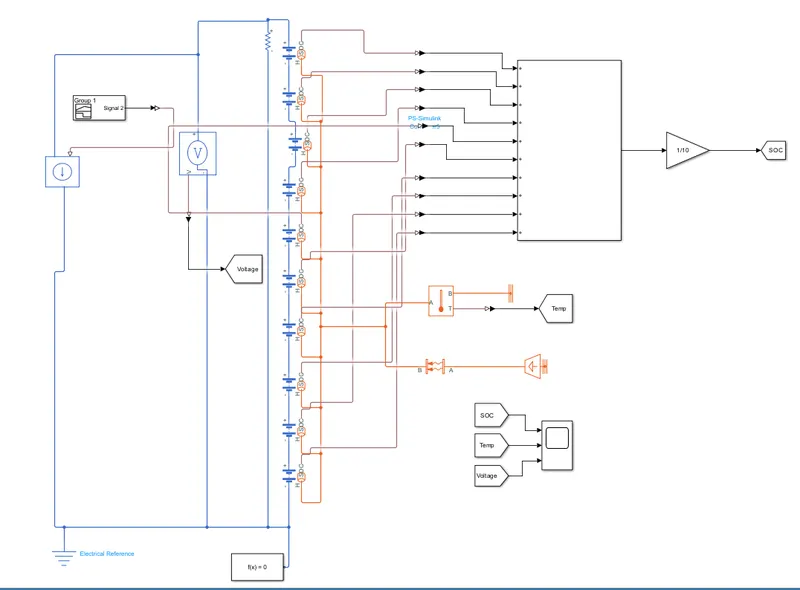
a)Thermal Reference
Reference connection for thermal ports
Library
Thermal Elements
Description
The Thermal Reference block represents a thermal reference point, that is, a point with an absolute zero temperature, concerning which all the temperatures in the system are determined.
b)Controlled Heat Flow Rate Source
Variable source of thermal energy, characterized by heat flow
- Library:
-
Simscape / Foundation Library / Thermal / Thermal Sources
Description
The Controlled Heat Flow Rate Source block represents an ideal source of thermal energy that is powerful enough to maintain specified heat flow at its outlet regardless of the temperature difference across the source.
Connections A and B are thermal conserving ports corresponding to the source inlet and outlet, respectively. Port S is a physical signal port, through which the control signal that drives the source is applied. You can use the entire variety of Simulink® signal sources to generate the desired heat flow variation profile. The heat flow through the source is directly proportional to the signal at the control port S.
The block positive direction is from port A to port B. This means that a positive signal at port S generates heat flow in the direction from A to B.
3)Thermal Mass
Mass in thermal systems
Library
Thermal Elements
Description
The Thermal Mass block represents a thermal mass, which reflects the ability of a material or a combination of materials to store internal energy. The property is characterized by the mass of the material and its specific heat. The thermal mass is described with the following equation:
Q=c·m*dT/dt
4)Temperature Sensor
Ideal temperature sensor
Library
Thermal Sensors
Description
The Temperature Sensor block represents an ideal temperature sensor, a device that determines the temperature differential measured between two points without drawing any heat.
Connections A and B are thermal conserving ports that connect to the two points where the temperature is being monitored. Port T is a physical signal port that outputs the temperature differential value.
The block positive direction is from port A to port B. The measured temperature is determined as T = TA – TB.
Battery :
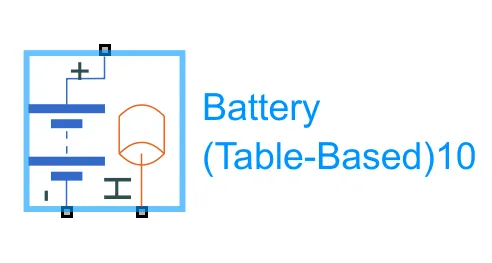
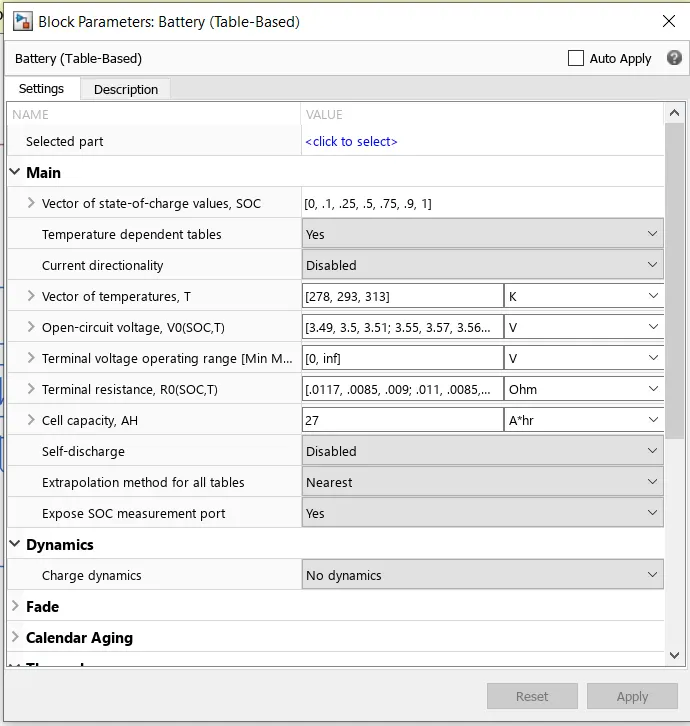
- Here a table based battery is used and a thermal port is added.
Signal Builder block :
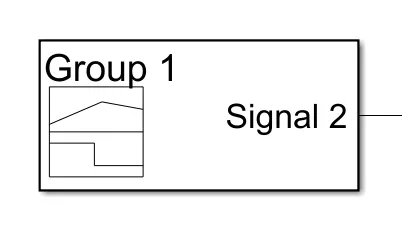
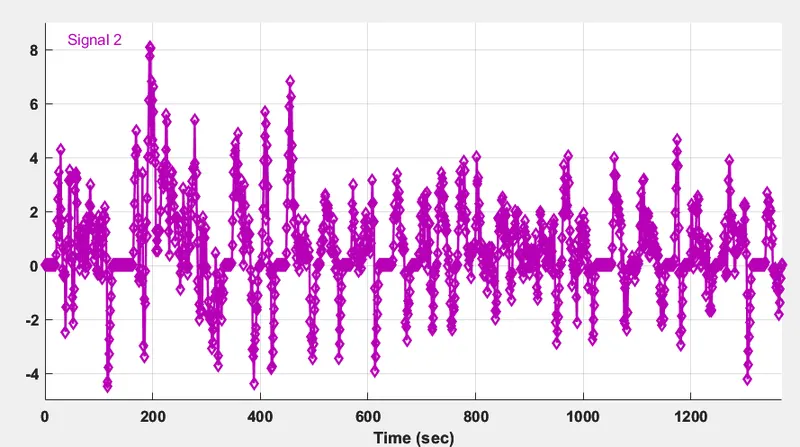
- Here UDDS signal is given as the input.
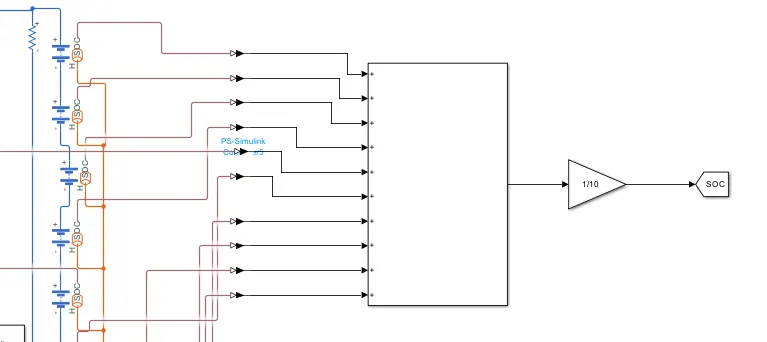
SOC calculation :
- Initially SOC port was added for every cell and then all the battery SOC's were added using sum block.
- Then they were divided by 10 to obtain average of the SOC.
Case 1:
- Temperature is taken as 300 K and the area of contact is taken as 10^2m.
- Stop time - 1369sec
Results :
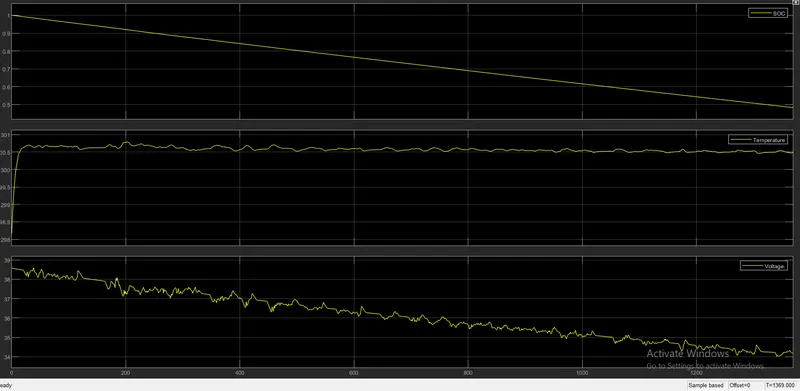
- Here it is seen that when temperature increases the SOC decreases.
- The temperature increases suddenly and when it reaches 300K,the temperature remains constant.
- In voltage graph the voltage decreases linearly with little ups and downs.
Case 2 :
- Temperature is taken as 350K and area is taken as 50m^2.
- Stop time - 1369sec.
Results :
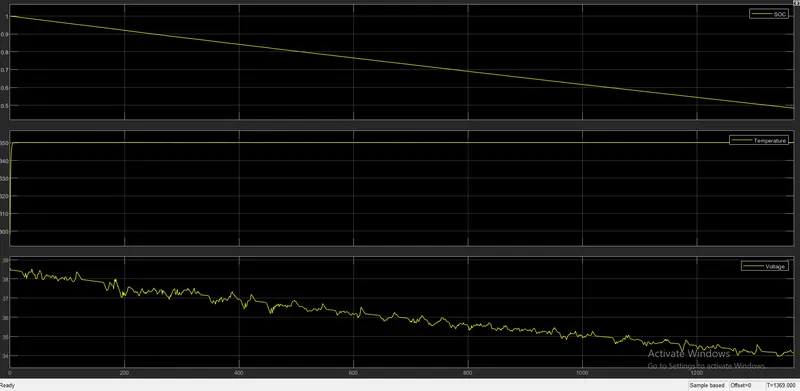
- Here it is seen that when temperature increases the SOC decreases.
- The temperature increases suddenly and when it reaches 350K,the temperature remains constant.
- In voltage graph the voltage decreases linearly with little ups and downs.
Conclusion :
Thus the using the simulink model we have observed the thermal effects and compared the life cycle performance at various temperatures.It is seen that when the temperature increases the SOC decreases linearly also by increasing the area we can reduce the effect of temperature and therefore we can maintain the SOC at a good level.