Project 2 Thermal modeling of battery pack
Aim:
To connect 10 cell series lithium ion battery model and to simulate the thermal effects and compare life cycle performance at various temperatures, charge & discharge rates using MATLAB.
Answer:
The tablebased battery is used in this model, so there are 10 batteries that are connected in series.
The series connection are the connection that is obtained when the opposite terminals of two different are connected together.
This is done in order to increase the voltage.
The simulink model is pasted below.
Blocks used:
Signal builder:
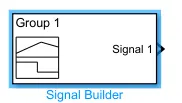
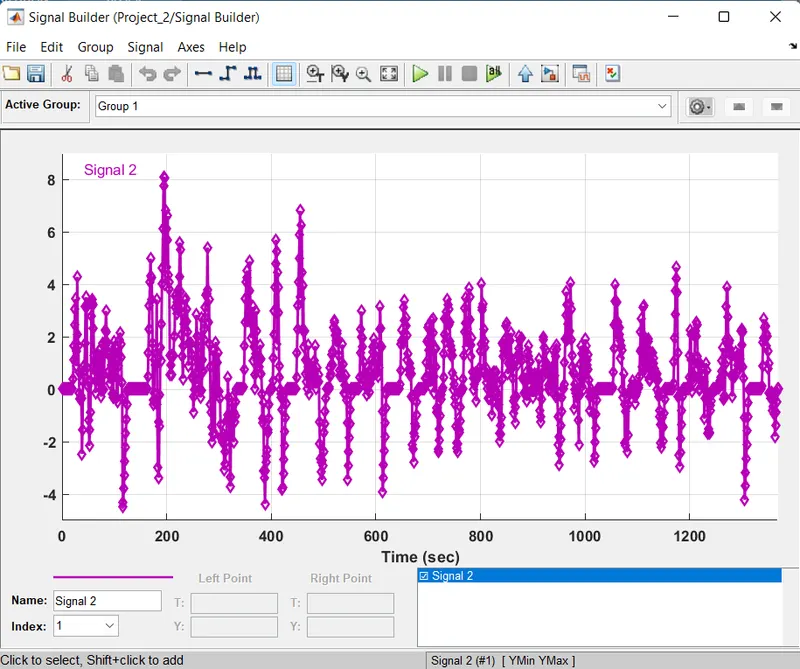
The signal builder is used to create the desired signal as per the users requirements, For this model we have used the Udds signal builder whose datas are created in the plot. The signal builder is shown below.
Controlled current source:

This block is used to give a controlled data to the simulink model are whatever we are using it to apply so that it is used to follow those signals to get the desired maintained current.
Battery (Table based)
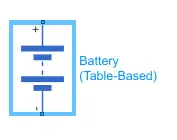
For this model we will be using the Table based lithium ion battery in order to know its outputs for the desired load.
The Soc port is obtained by modifiying the following options
The Thermal port is also obtained by modifiying the Thermal omit section
Temperature source:

The temperature source is used to produce the Temperature siganl in which the thermal system is obtained in order to check the heat obtained in the battery.
Convection Heat Transfer:
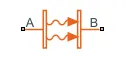
The convection heat transfer is used by which the heat is transmitted from the thermal source to the battery in order check the amount of heat obtained during the discharging process
Temperature sensor:
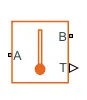
The Temperature sensor is used to sense to temperature and to represent it into the digital form for the plotting section
Ps-simulink convertor:
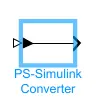
In order to convert the physical to simulink convertor we need this block which is used to convert it back into the simulink sections.
Scope:

The scope is used to get the plots obtained as per the requirement
Gain:
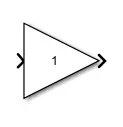
Since we are using 10 cells we need to get the plot for the entire battery which is obtined by adding and dividing the values with the average of 10
Add :
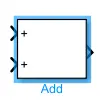
Since we are using 10 batteries we need to add them in order to get the average of those and to get it into a single signal
Simulink Model:
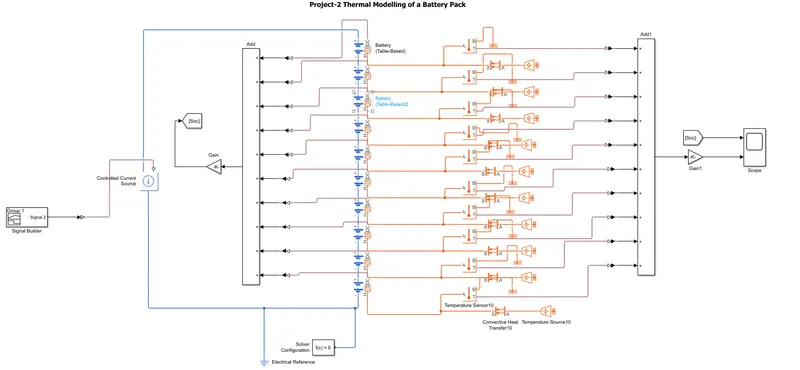
Explanation:
- The Battery is taken and connected in series as per the given question and also the modification are done in order to get the Thermal and Soc port
- The signal builder is used by means of applying the Udds cycle and it is connected to the controlled current source by which we need the controlled current to the battery
- The Temperature source is taken into consideration so that we can get the know the temperature of the battery which is then connected to the convection Heat source
- A temperature sensor is used in order to get the Temperature plot
- All the Soc and Temperature sources are added up so that we can get the one single signal in order to know the overall plot of the battery
- And finally the signals of the soc and the Temperature are sent to the scope
- Here we have used two different domains so we need the references
- And then the solver is used in order to run the simulation
- The readings are taken which are analysed for the different condition of the area
Output:
Case1
For Area=1e-4 & Temp=298.15K
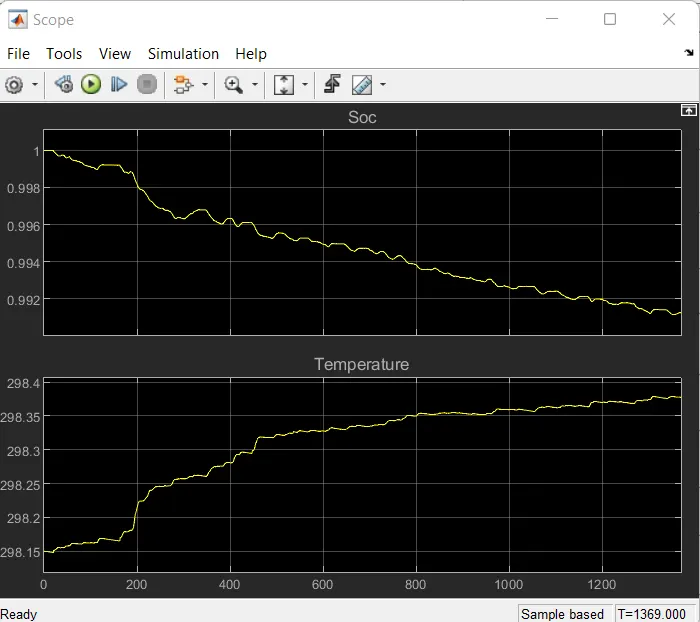
Soc Plot
The soc reduces from the full 100% to 99.2% for overall runtime
Temperature plot
The Temperature starts from 298.15K initially and ends to 298.38K
Case:2
Area=0.1m^2 & Temp=393.15
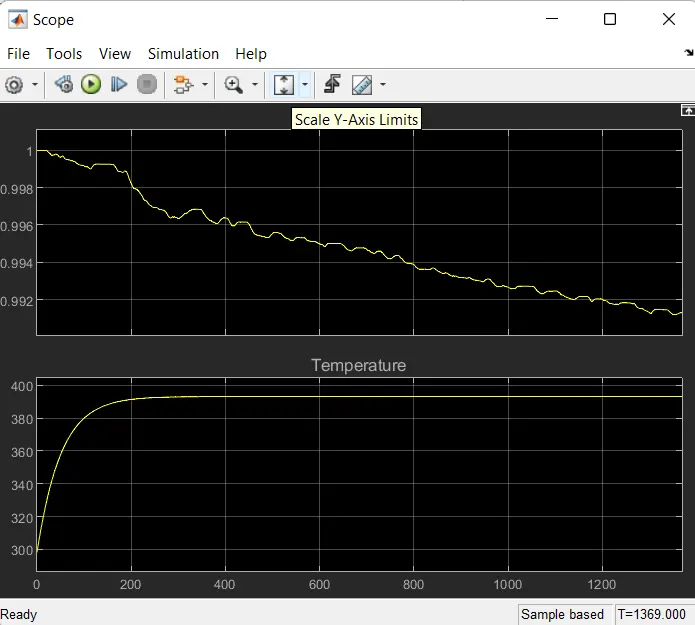
Soc plot
The soc remains the same as the previous condition
Temperature
The temperature increases within a few seconds from 150s and it is constant till the end of the cycle.
Case:3
Area=1e-4 & Temp=393.15K
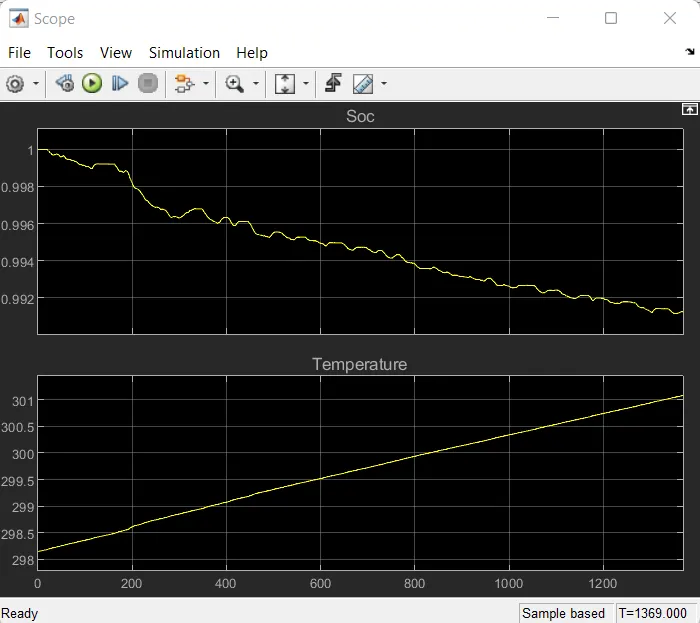
Soc plot
The soc plot the same as that of the previous one
Temprature plot
The Temperature increases gradually from 298K to 301K as we have increasesd the temprature of the heat source.
Charging conditon
Area=1e-4 & Temperature=393.15
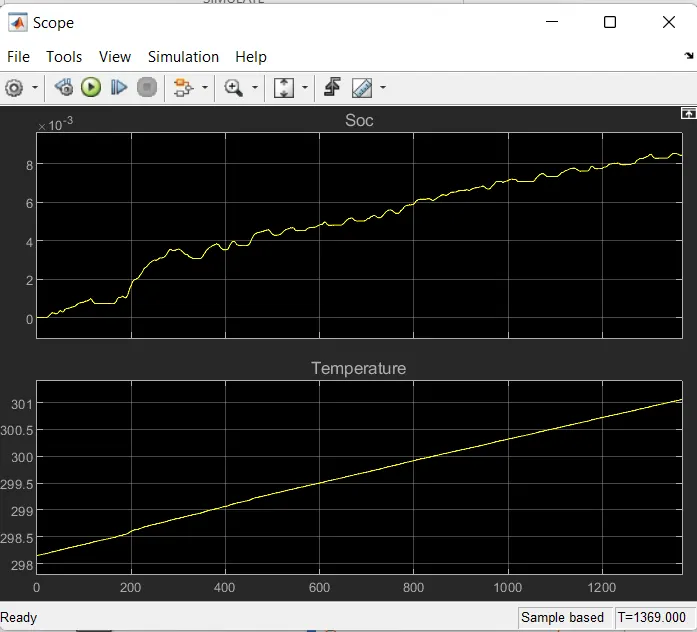
Soc
The soc starts from 0 initially as it is in the charging condition and ends at 82%
Temperature
The tempetature slightly increases from its initial of 298.15 to 301K
Conclusion:
The various conditon by varying the temperature of the heat source and also the Area of the heat source, we can observe that the following conditon
- The Soc remains constant for the situation
- The temperature increases gradually upto the 301K and when we modify the Area we can see the huge rise since the area is increased