Project 2 Thermal modeling of battery pack
Thermal Modeling of Battery Pack
Objective: For a 10-cell series lithium-ion battery model, simulate the thermal effects and compare life cycle performance at various temperatures, charge & discharge rates using MATLAB.
INTRODUCTION:
The temperature of a Lithium battery cell s important for its performance, efficiency, safety, and capacity and is influenced by the environmental temperature and the charging and discharging process. Battery Management Systems (BMS) take into account this effect. As the temperature at the battery cell is difficult to measure, often the temperature is measured on or nearby the poles of the cell. However, the accuracy of predicting the cell temperature with those quantities is limited. Therefore a thermal model of the battery is used to calculate and estimate the cell temperature.
This project uses a simple representation of the thermal model. It shows how the thermal parameters are identified using input/output measurements only, where the load current of the battery represents the input while the temperatures at the poles represent the outputs of the measurement. With a single measurement, the eight model parameters (thermal resistances, electric contact resistances, and heat capacities) can be determined using the least-square method. Experimental results show that the simple model with the identified parameters fits very accurately with the measurements.
For a 10-cell series lithium-ion battery model, Simulating the thermal effects and comparing life cycle performance at various temperatures charge & discharge rates using MATLAB:
So, for the 10-cell series lithium-ion battery pack, We used MATLAB Simulink to find a thermal effect and life cycle performance related to temperature, charge, and discharge.
A Default Matlab Simulink Model of Lithium-lon Battery Pack With Fault, which We used for 10-cell Battery Pack Thermal Modelling.
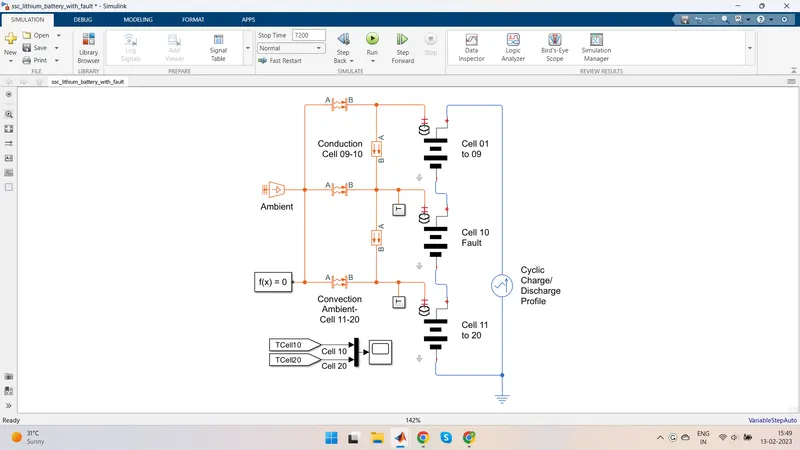
- Lithium-lon Battery Pack with Fault is to simulate a battery pack consisting of multiple series-connected cells efficiently. It also shows how a fault can be introduced into one of the cells to see the impact on battery performance and cell temperatures
- For efficiency. Connecting cell models do not just model identical series-connected cells in series. Instead, a single cell is used, and the number of cells scales up the terminal voltage.
- The fault is represented by changing the parameters for the Cell 5 Fault subsystem, reducing both capacity and open-circuit voltage and increasing the resistance values.
Matlab Simulink Model of 10-cell Series Lithium-lon Battery Pack for Thermal Modelling-
Battery Pack Model Explanation :
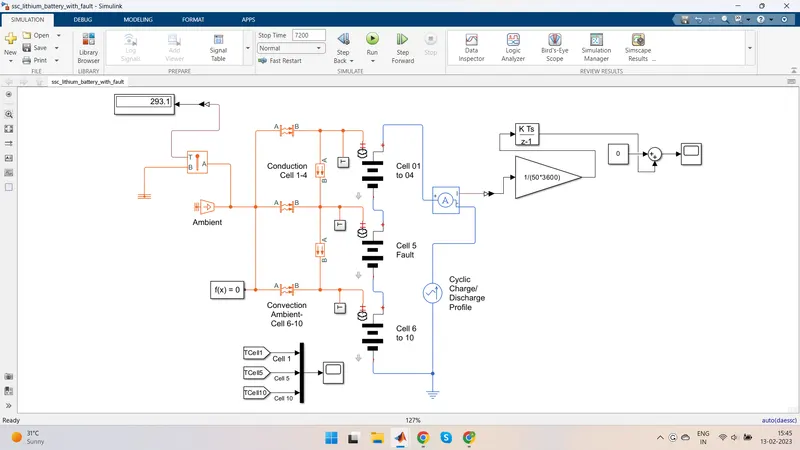
Cell 01 to 04 Subsystem Block -
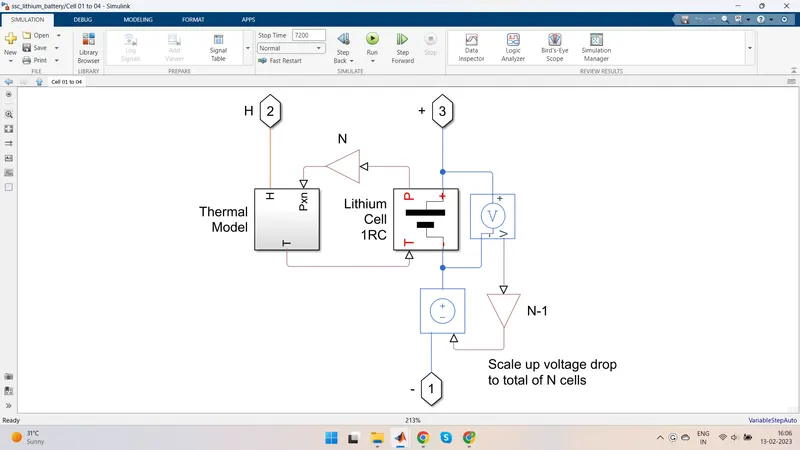
- Cell subsystem basically consists of a Thermal Model and Lithium Cell 1RC block which calculates the temperature and thermal effect of the battery pack.
- The block which are inside the cell subsystem is PS Gain block which multiplies the input physical signal by a constant i.e. y = u gain. Other blocks are the voltage sensor and Controlled-voltage source.
- The voltage sensor block represents an ideal voltage sensor, that's converts voltage measured between any electrical connections into a physical signal proportional to the voltage.
- A controlled voltage source represents an ideal voltage source that is powerful enough to maintain the specified voltage at ts output regardless of the current passing through it. The output voltage is V - Vs, where Vs is the numerical value presented at the physical signal port.
Thermal Model Subsystem Block -
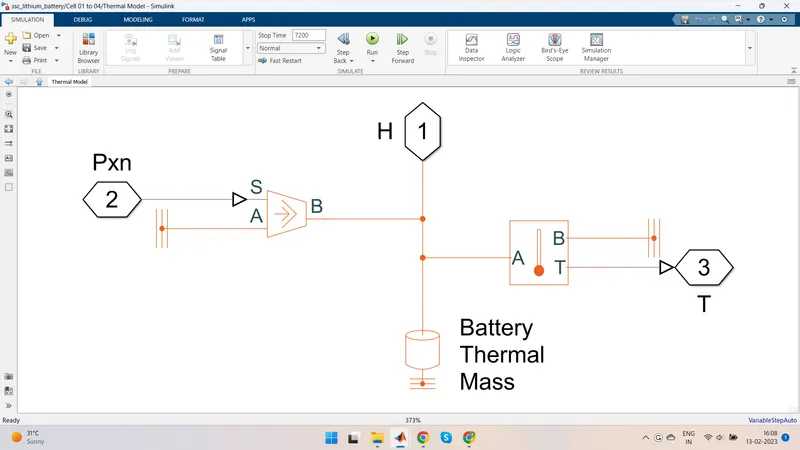
The important block which is inside the thermal model subsystem are:
- Thermal Reference- This block represents a reference point in a thermal network where the temperature equals absolute zero.
- Controlled heat flow rate source- This block represents an ideal energy source in a thermal network that can maintain a controlled heat flow rate regardless of the temperature difference. The physical signal port S. A positive heat flow rate sets the heat flow rate
flows from port A to port B. - Thermal Mass - This block models internal energy storage in a thermal network. The rate of temperature increase is proportional to the heat flow rate into the material and inversely proportional to the mass and specific heat of the material.
- Temperature Sensor- This block measures temperature in a thermal network. There is no heat flow through the sensor. The physical signal port T reports the temperature difference across the sensor. The measurement is positive when the temperature at port A is greater than at port B.
Lithium Cell 1RC Subsystem Block-
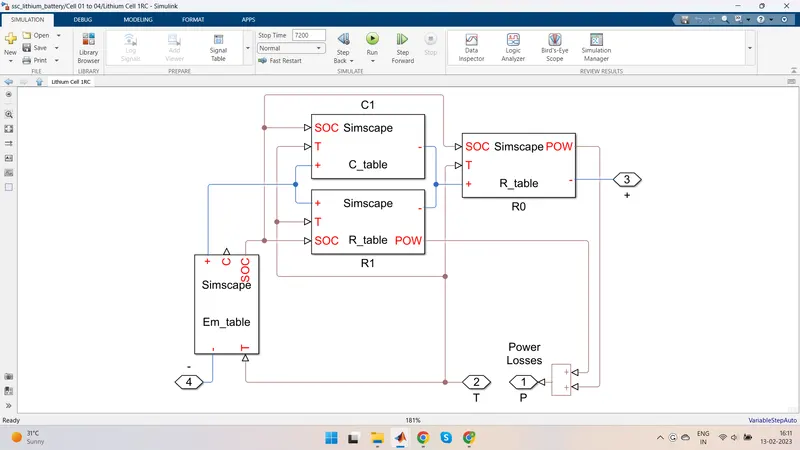
- This block basically consists of capacitance value table which depends on an external physical signal inputs SOC and T. It is assumed that the capacitance value is slowly varying with time, and hence the equationi = C'dv/dt holds.
- Resistance value (R) table which depends on an external physical signal inputs SOC and T.
- Voltage value (EM) which implements the cell's main branch voltage source, and determines values for capacity (C) and state of charge (SOC). The defining equations depend on cell temperature, T.
Thermal Behaviour and Fault Setup-
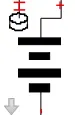
Lithium-ion cell one RC-Branch equivalent circuit detail for 10 cells.
Block Parameters For Cells :
For Cell 01 to 04 -
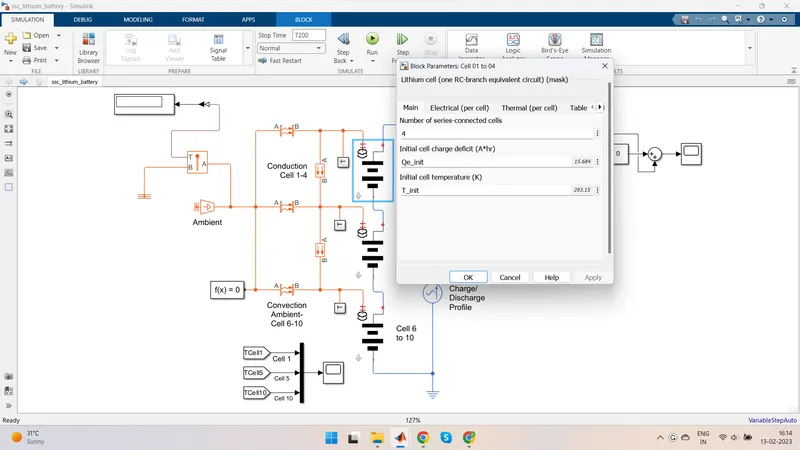
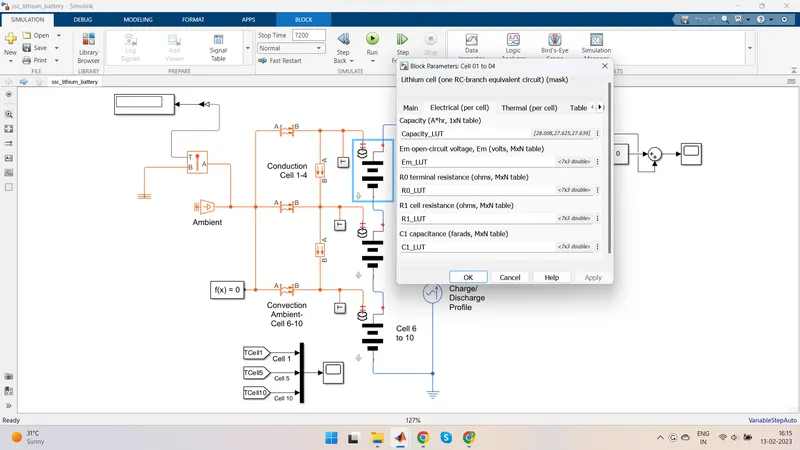
The value of intial Cell temparature (T_init) is the same for all cells, Which is 293.15 K.
For Cell 05 (fault setup)-
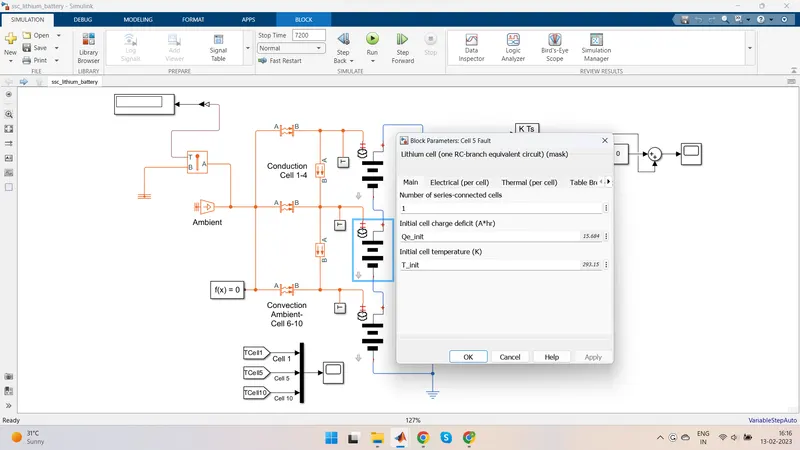
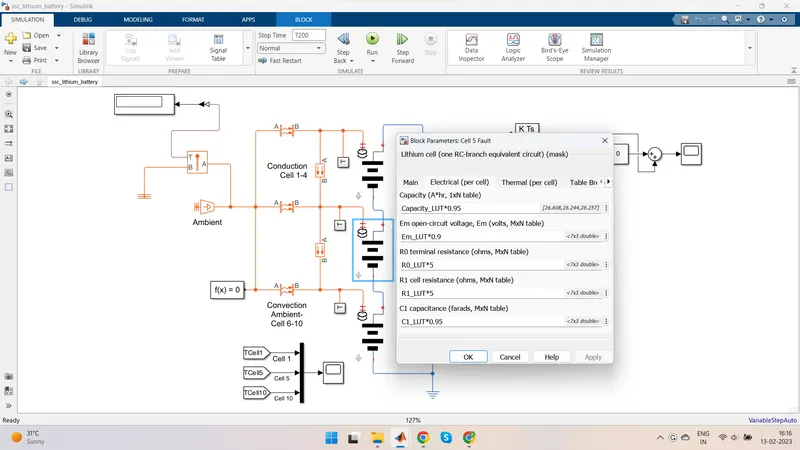
In this cell, We havemadee some changes in the Electrical system of the cell so that we can see the fault.
For Cell 06 to10 -
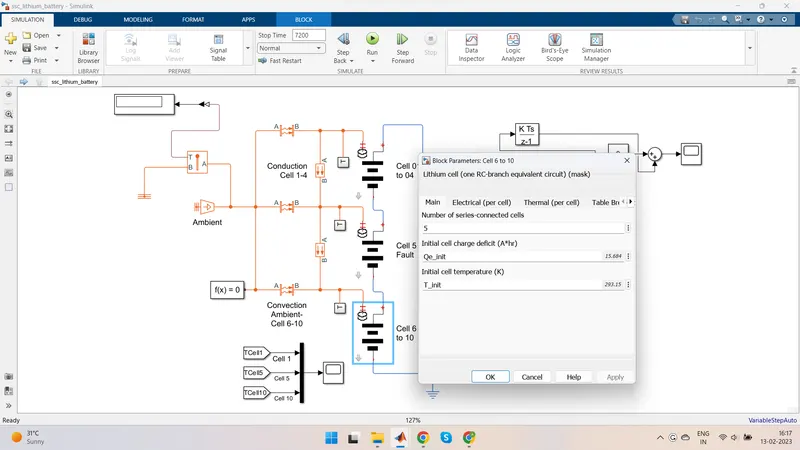
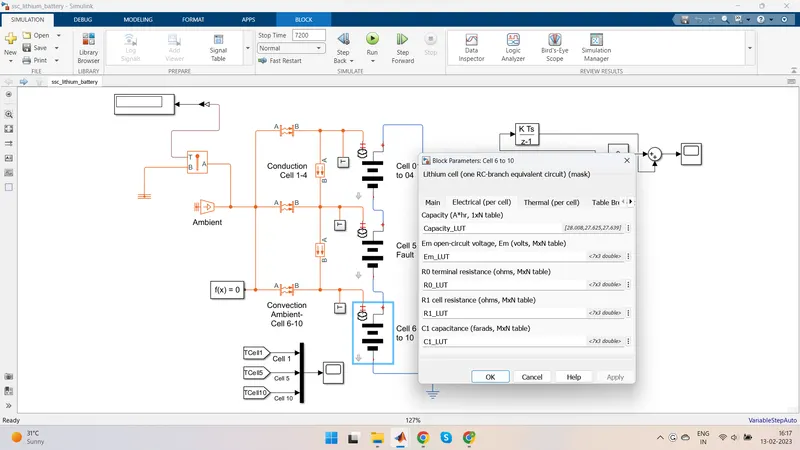
AC Cuurent Source Block with Parameters -
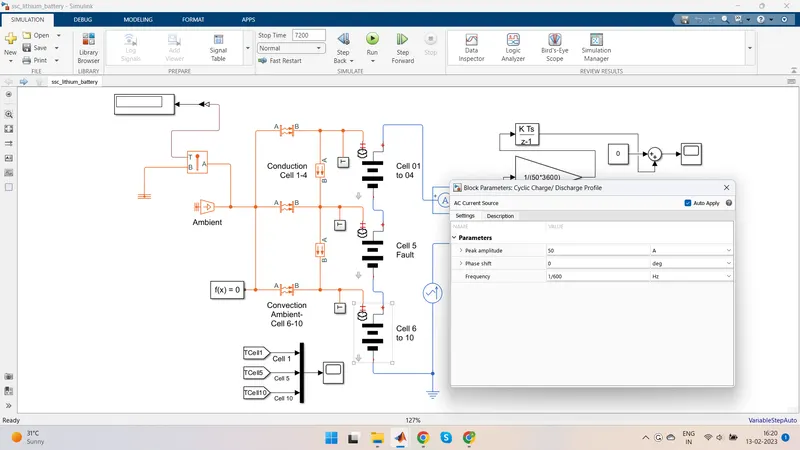
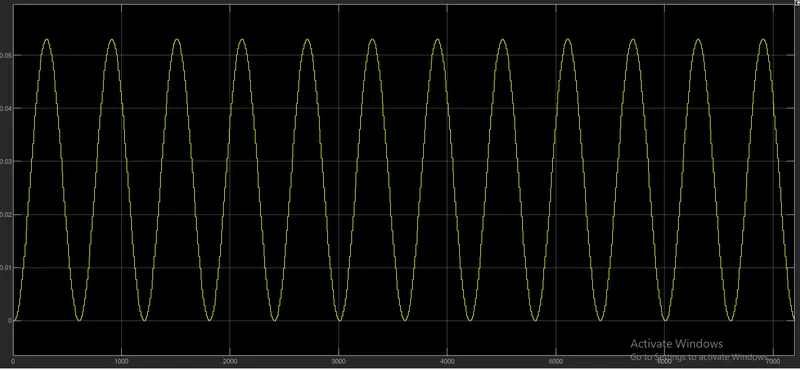
The peak amplitude was set to 50A for cyclic charge and discharge.
The Other Blocks which are used in the lithium-ion battery pack are as Following :
Temparature Source -

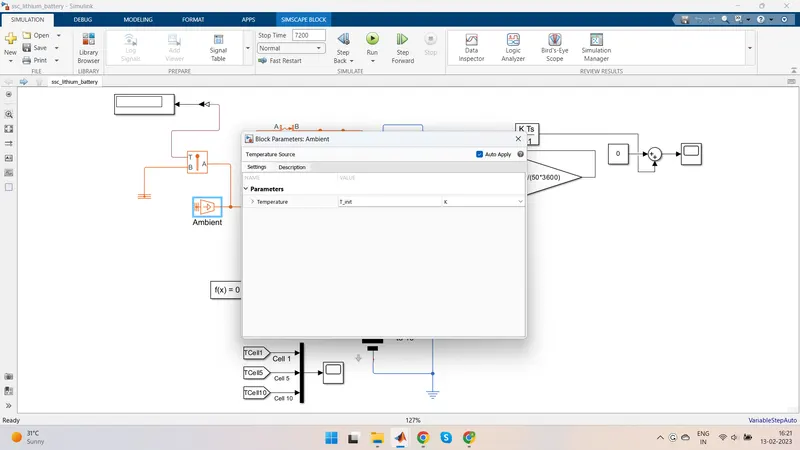
Here we used this Block for ambient temparature and ambient temparature(T_init) is set as 293.15 K or 20degrees C.
Convective Heat Transfer -

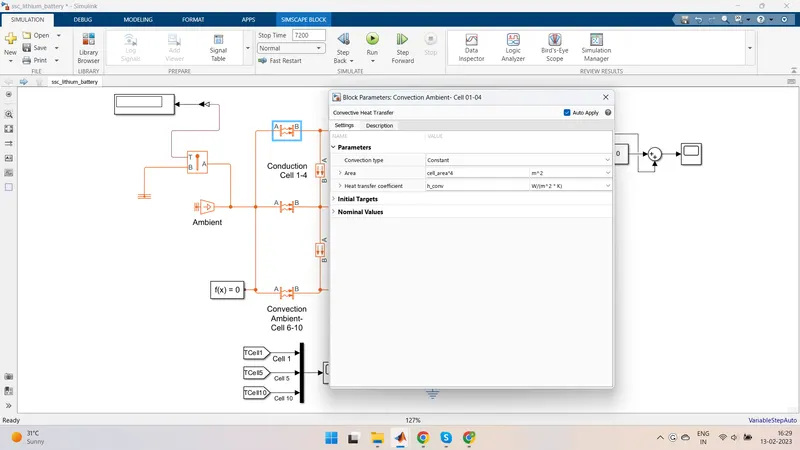
- This block modelsheat transfer in a thermal network by convection due to fluid motion. The rate of heat transfer is proportional to the temparature difference, heat transfer coefficient, and surface area in contact with the fluid.
- Here we use 3 blocks for convection for 3 different cell packs.
Conductive Heat Transfer -

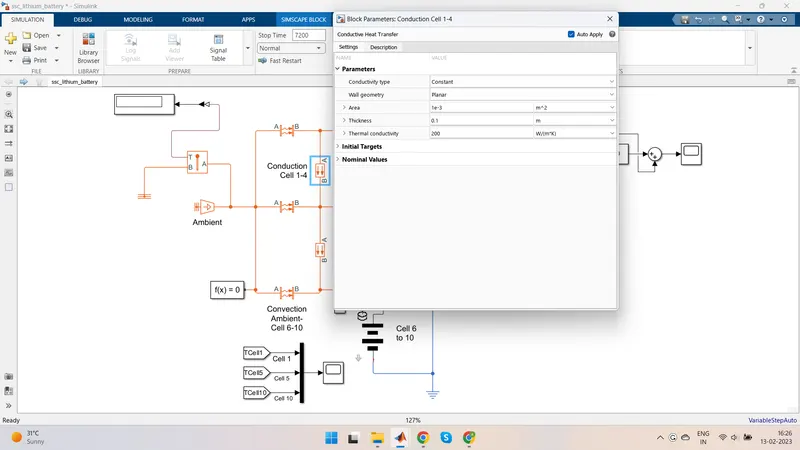
The conduction is done from the 2sets of blocks, 1 block is used for 04-05 and the other is used for cells 05-06.
SOC Estimation Model -
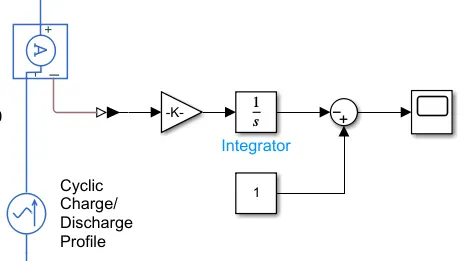
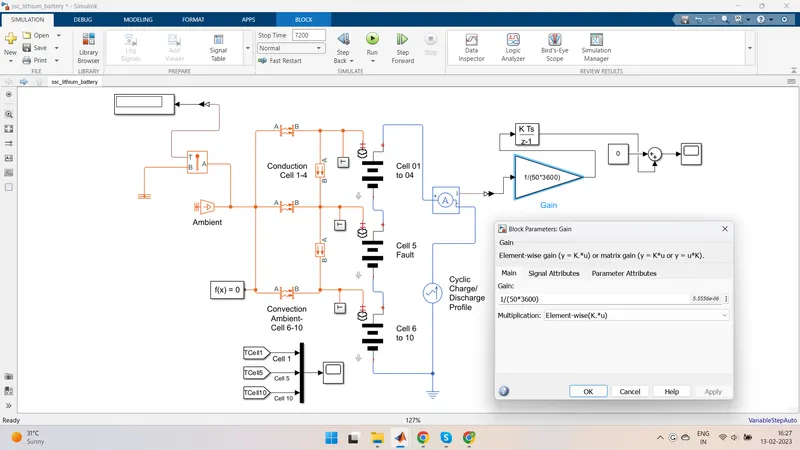
- For SOC calculation, we used Gain block, Integrator, and Sum block with PS Simulink convertor.
- This model estimates the battery SOC % using the coulomb counting method. The initial SOC of the battery is assumed to be 100%(1).
- The Coulomb counting method measures the discharging current of a battery and integrates the discharging current over time too estimate SOC.
- This subsystem takes current as input and gives the battery SOC % as output. A current sensor block is used to measure current discharge and is connected to soc estimation.
Results:
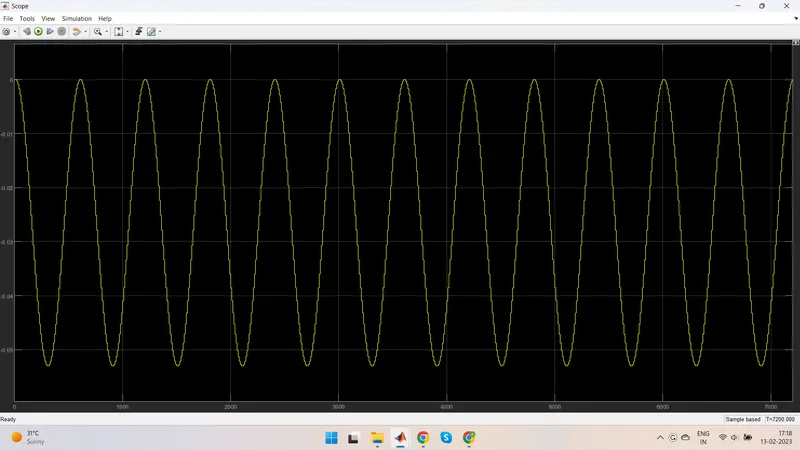
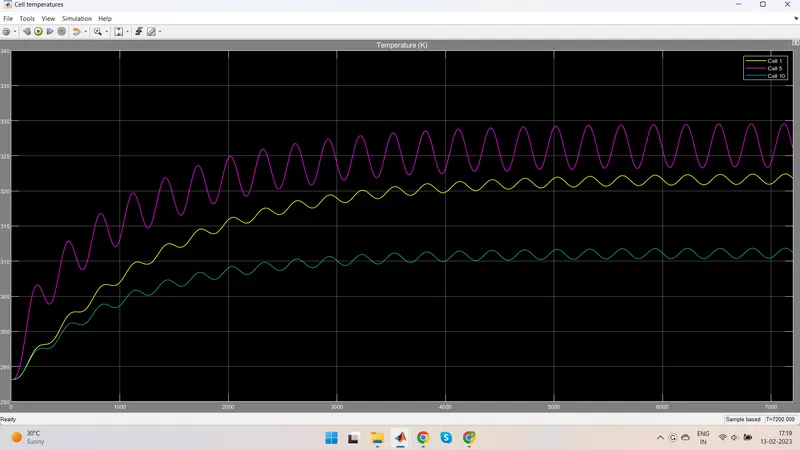
At 293.1K Temperature
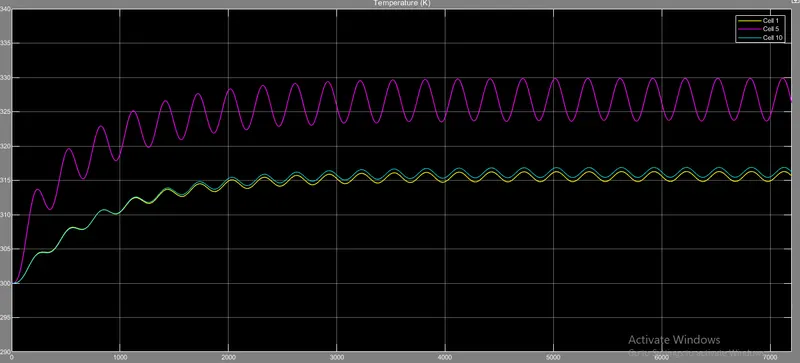
At 300K Temperature:
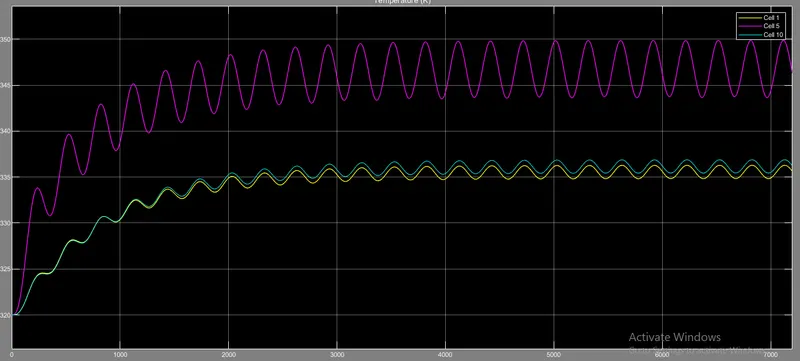
At 320K Temperature:
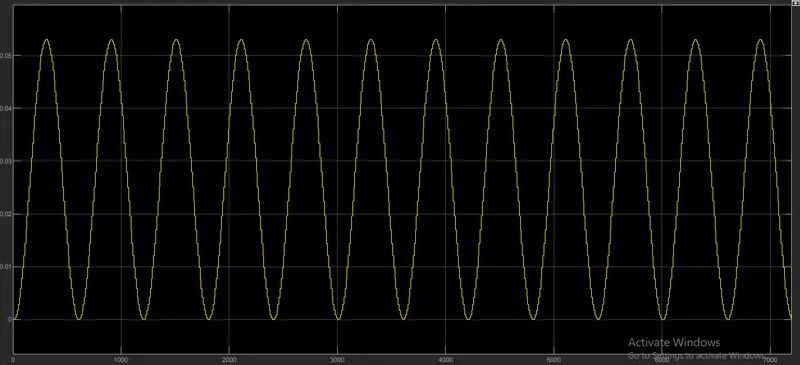
- For a 10-cell series lithium-ion battery model, we simulated the thermal effects and compared life cycle performance at various temperatures and charge & discharge rates using MATLAB.
- 1-4 cells are normal, 5th cell is faulty, 6-10 cell is normal
- We are simulating the thermal effect; we give Cyclic Charge/ Discharge Profile to the circuit
- From the above results, all conditions it is the same, but when ckt is run on this drive cycle profile as the 5th cell was faulty, it will show a temperature rise high than any other cell, and the life cycle of the cell gets reduced, and cell even can get damaged
- So as we give temperature at 293.15, the 1-4 and 6-10 cell temperature is near 308k, but the 5th faulty cell temp goes to 320k, and the drive cycle is shown which is Cyclic Charge/ Discharge drive cycle
- In condition two, we give a temperature of 300 k. The 1-4 and 6-10 cell temp is near 316 k, but the 5th faulty cell temperature goes to 325kand the drive cycle is shown which is Cyclic Charge/ Discharge drive cycle
- In condition three, we give a temperature of 320 k, i.e., the 1-4 and 6-10 cell temperature is near 336 k, but the 5th faulty cell temperature goes to 346k, i.e., 80.85°C and the drive cycle is shown which is Cyclic Charge/ Discharge drive cycle
CONCLUSION
we simulated the thermal effect and compared it at various temperatures; faulty cell temperature rise is more than the normal cell charge, and the discharge cycle is given, and due to temp rise, it can damage the cell and reduce the battery's performance.