Project 2 Thermal modeling of battery pack
For a 10-cell series lithium-ion battery model, simulate the thermal effects and compare life cycle performance at various temperatures, charge & discharge rates using MATLAB.
Here we select a battery model from Matlab and set the capacity to 2Ah. we have connected 10 such cells in series and are connected to a constant current load through a controlled current source. The constant block is given a value of 2 in order to get a 1C rate. The Simulink model is given below.
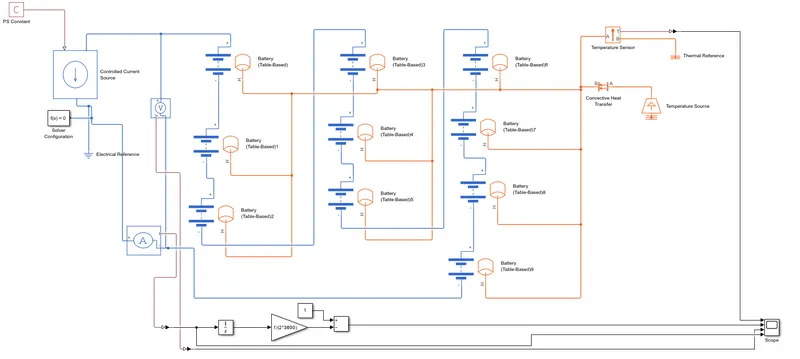
The temperature ports in the battery system are connected to the common port which is further connected to a temperature port. a steady temperature is given through convective heat transfer from the temperature source. We delete the SOC port and use the Columb counting method for soc estimation.
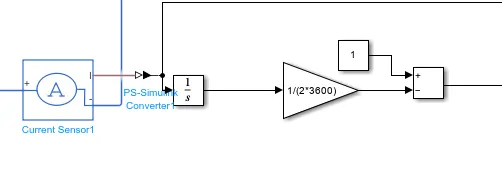
the current measured is used in order to calculate the SOC using the coulomb counting method. The SOC and current outputs are connected to a scope. A voltage sensor is used to calculate the voltage and connected it to the scope.
The temperature is studied by using the temperature sensor connected to the port and the output is taken using a scope.
The current = 2 A
the temperature = 200 K
Area of convection = 0.0001
We simulate the model for 3600 sec by keeping the input signals as above.
The scope output is given below.
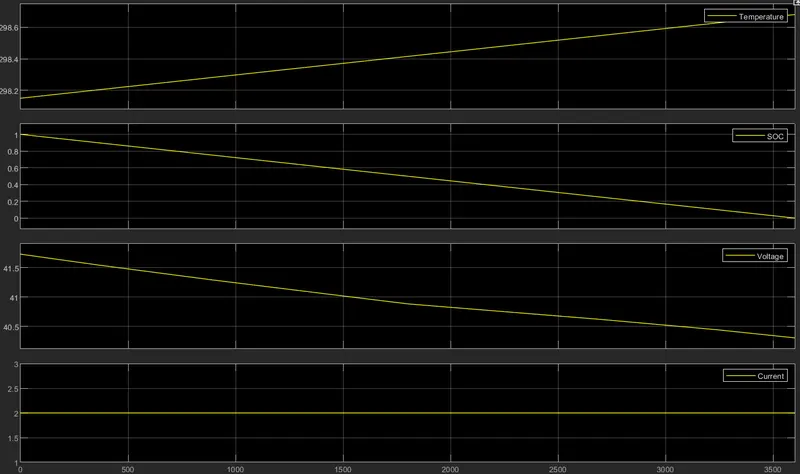
From the above plots, we can able to see that the SOC depletes over time to 0 and the voltage decreases from 41.5 and there is no significant change in temperature and current.
Now we change the input parameters as given below.
The current = 2 A
the temperature = 300 K
Area of convection = 0.001
The output plot is given below.
The above plot shows the change in temperature has raised around 2K from the change in parameters and the rest outputs are the same. so we further change the parameters below
The current = 1 A
the temperature = 350 K
Area of convection = 0.01
The plot output result is given below
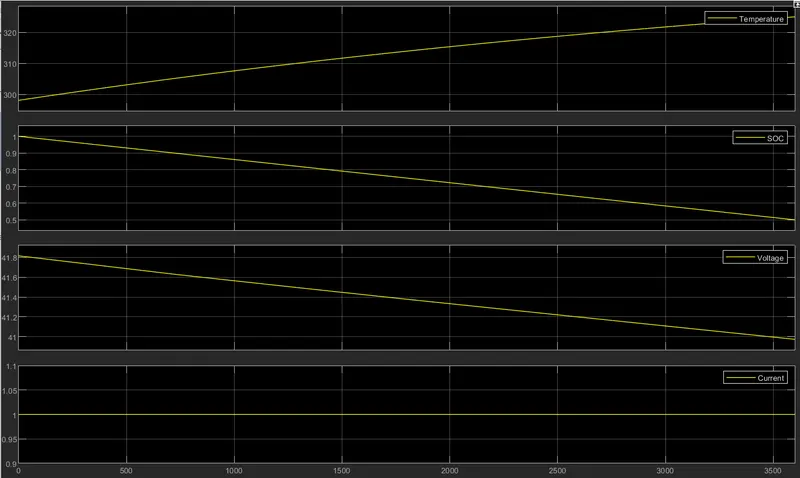
So from the plot, we can see that the current demand is 1 A which is a 0.5C rate so the SOC has depleted only 50%. there is a significant change in temperature as it increases from 298.4 to 325 K.
So we can conclude that with the change of crate and temperature inputs the output, properties are varied and the voltage is independent of these parameters.
The aging effect of generic battery
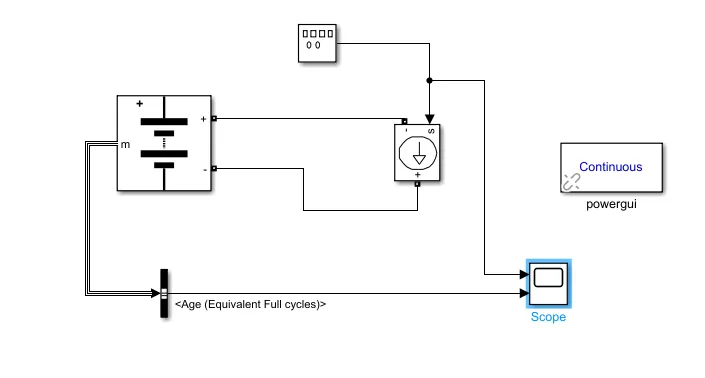
We select a generic battery and switch the aging effect on. then we change the aging model sampling time to 20.
The current demand is given through the controlled current source by a signal generator. the amplitude of the signal generator is set the same as the battery capacity and the frequency is set to 1/3600 Hertz. The scope output of the aging effect is taken out through the bus selector.
The model is simulated for 3600*10 secs and the output plot is given below.
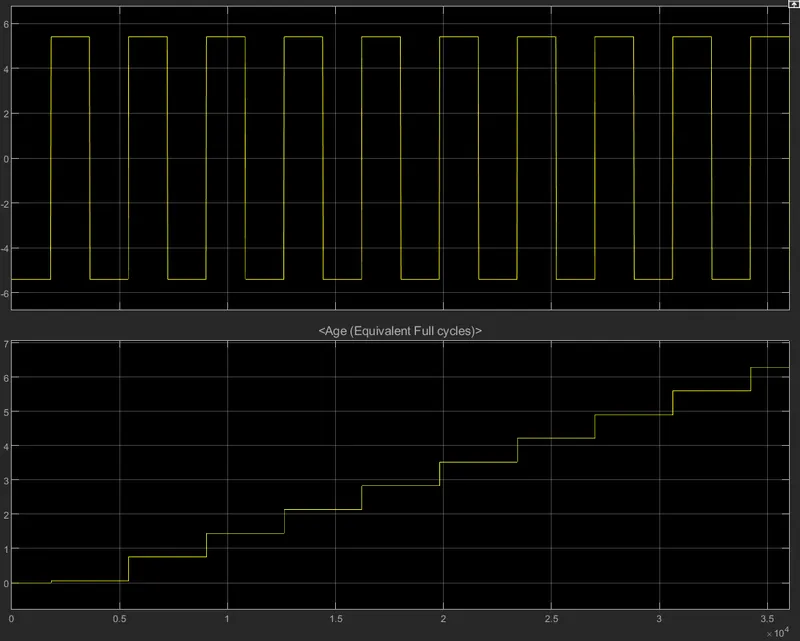
From the plot, we can able to see that the aging plot steps after each cycle of charging and discharge.